
Robert Bradley (President) & Thomas Tanton (Senior Fellow),
Institute for Energy Research
December 19, 2005
Executive Summary
U.S. petroleum refining experienced an unprecedented disruption when a tight crude-oil market was joined by major infrastructure damage from hurricanes Katrina and Rita. Suddenly, less supply was available to meet strong demand, and prices spiked for petroleum products, particularly gasoline.
The price issue became politicized with charges of “gouging” and “profiteering,” and lawmakers responded with new legislative proposals. Some proposals would regulate or tax the industry, particularly “Big Oil.” Other proposals would create new subsidies to encourage the construction of enough spare refining capacity to cushion consumers from future hurricanes in the Gulf Coast energy belt.
But a review of industry performance in the three months since the hurricanes supports a let-the-market-decide policy, one that avoids both penalization and subsidization of the domestic refining industry. Lost production is coming on stream, and gasoline prices are back to pre-storm levels. Challenges remain, but further price declines for petroleum products can be expected from continued infrastructure recovery and any crude-oil price declines.
This post–Katrina/Rita recovery is part of a long history of continuous improvement in the U.S. refining industry. There is no structural failure requiring government intervention to protect energy consumers. On the contrary, as a recent study by the U.S. Federal Trade Commission reconfirms, gasoline markets can be made more competitive through free-market reforms.
U.S. Petroleum Refining: Let the Market Function
Introduction
Numerous statistics indicate positive trends in the midstream and downstream oil markets, led by the domestic petroleum refining industry [1]. Domestic capacity has expanded, and there is a robust product-import market. Increased refining efficiencies have moderated crude-oil price rises since the 1970s. Products have been reformulated to improve environmental performance.
In the face of these facts, there has been little criticism of the oil processing industry. Although localized price spikes have from time to time raised controversy, one searches in vain for market-failure arguments in the popular press or the academic literature. For example, in the twenty-five-year history of The Energy Journal, the flagship publication of the 3,000-member International Association for Energy Economics, there has not been an entry about market failure in oil refining [2]. In contrast, there have been active debates over the role of markets and government in interstate oil and natural gas transportation, natural gas distribution, and electricity transmission and distribution.
But something unprecedented happened during August and September 2005. Back-to-back hurricanes rocked the energy infrastructure of Louisiana and Texas, interrupting the operations of as much as 30 percent of national refining capacity. Disrupted offshore production and transportation added to industry challenges. Gasoline prices rose disproportionately higher than crude-oil prices, which critics lambasted as “price gouging.” A political hurricane put the refining sector in the spotlight for the first time since labor-union problems led to emergency federal intervention sixty years ago [3].
Economics 101 in theory and practice, not emotion, should guide public policy. The laws of supply and demand that were at work before the capacity immobilization were at work during and after the crisis. What Adam Smith called “the invisible hand” performed well even in a very challenging, unprecedented scenario. Thus, there will be no market-failure essays focusing on the Katrina/Rita case study in future issues of The Energy Journal—quite the opposite. Higher prices predictably reduced the quantity demanded and attracted much-needed imports of gasoline to limit consumers’ pain. The industry, meanwhile, losing money with every hour of lost production, worked feverishly to restore capacity. The U.S. Energy Information Administration has forecast a full recovery by the end of the second quarter of 2006.
Higher refining margins in recent years have led to planned capacity additions, domestically and internationally. Few if any new refineries are likely to be built in the United States, however. This is because (among other factors) the financial disadvantage of building from scratch versus incrementally expanding existing capacity, the issue of permits aside. In all, the price- and profit-driven market process is ably at work, promising to bring the issue of pricing petroleum products back again to the issue of the globally-set price of crude oil.
Part I. Gasoline Prices
A. Before and After Katrina and Rita
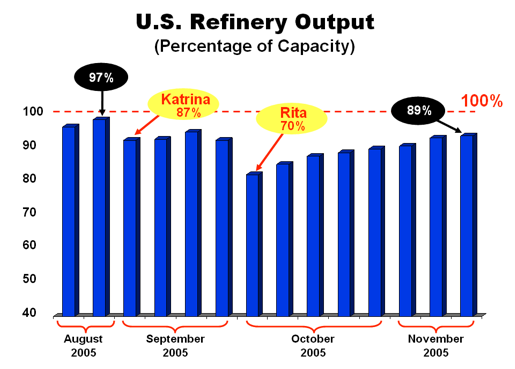
Prior to Katrina, U.S. refineries were operating at peak levels, reaching 97% of capacity for the week ending August 29. Katrina reduced utilization to 87%, and Rita several weeks later left domestic utilization at a low of 70% for the week ending October 3. The industry recovered to nearly 90% by late November, as shown in Figure 1, and is now operating at 91% of capacity.
Figure 1
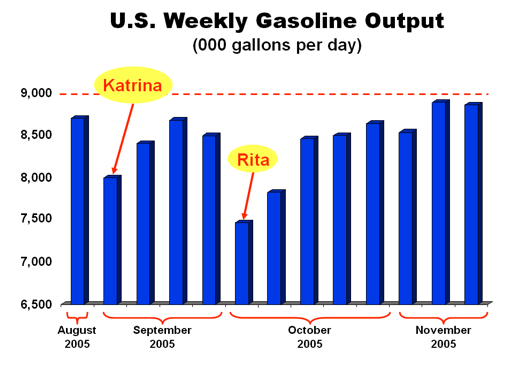
Gasoline production drove the above utilization rates. As shown in Figure 2, sharp declines were registered with Katrina and Rita. Gasoline output has recovered, and seasonal demand has tilted refinery slates from gasoline to home heating oil to meet the Northeast’s winter needs.
Figure 2
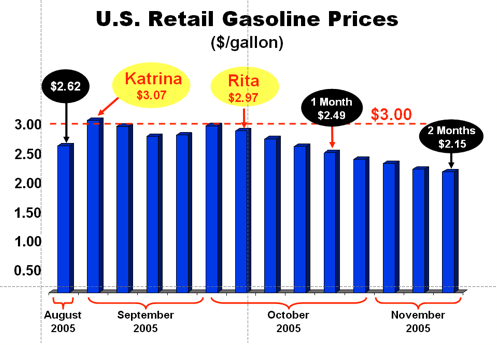
Gasoline prices reached a recent-year high of $3.07 per gallon the week ending September 5, which was during the Labor Day driving peak. Gasoline prices have since dropped below pre-storm levels (see Figure 3), although diesel fuel since mid-October has remained high owing to higher seasonal demand for distillate fuel and limited distillate imports because of Europe’s demand for fuel-oil.
Figure 3
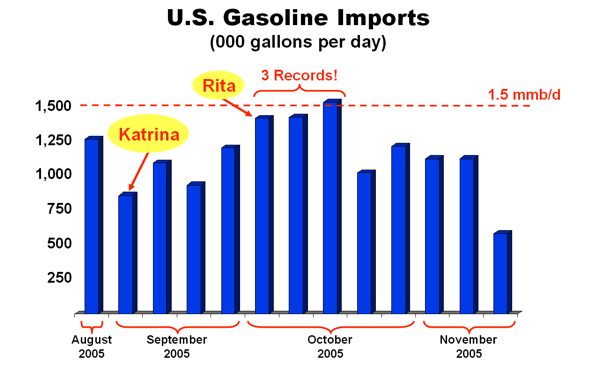
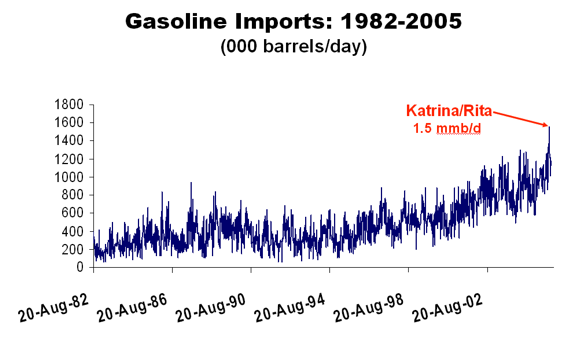
In a free market, the cure for high prices is high prices. The Katrina-generated spike in gasoline prices sent a signal heard ‘round the world. Oil is a global commodity, and gasoline tankers raced to the U.S. and in particular to the highest priced market, the Gulf Coast. “The cavalry came in the form of the surge in gasoline imports,” summarized the Energy Information Administration, “setting all-time records in three successive weeks … that was critical in helping to keep gasoline prices from going higher following Hurricane Rita, and to help them start dropping substantially thereafter [4].” Gasoline imports to the U.S., which were depressed by Katrina but arriving at the time of Rita, are shown in Figure 4.
Figure 4
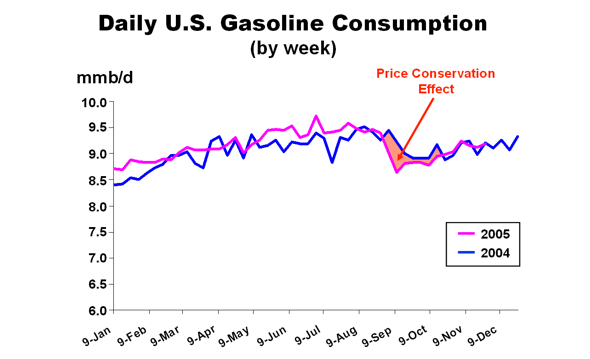
Conservation on the demand side, not only imports from the supply side, created the new equilibrium in the face of lost domestic output. As seen in Figure 5, year-to-year demand growth in 2005 (versus 2004) was reversed in September and October. The price-induced conservation effect was orderly compared to its opposite—the misery effect of shortages at the pump from underpricing. With gasoline prices returning to pre-hurricane levels by late November, total consumption in 2005 will outdistance that in 2004.
Figure 5
B. Long-Term Trends: 1949-2004
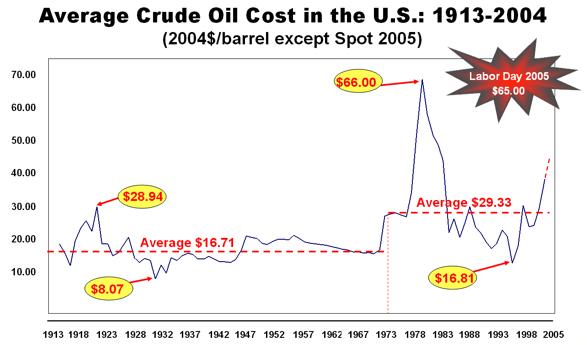
The recent hurricane-related price peaks for crude oil and gasoline did not set inflation-adjusted records as seen in Figure 6. Labor Day’s $65 per barrel crude oil was 11% below March 1981’s high of $72 per barrel and the year-1981 high of $66 per barrel. Still, the 2005 level of crude oil prices is well above the post-1973 annual average of $29 per barrel, and certainly the 1913–2004 average of $21 per barrel.
Figure 6
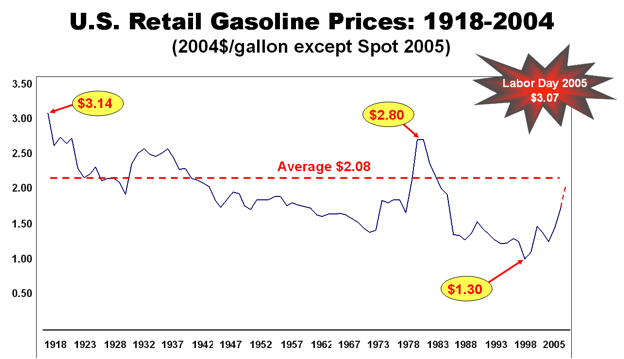
Domestic retail gasoline prices in 2004 were below the 1918–2004 annual average of $2.08 per gallon despite having a higher tax component (averaging around $0.40 per gallon today). Post-Katrina, the Labor Day gasoline peak of $3.07/gallon (see Figure 7) was still below March 1981’s monthly high adjusted for inflation.
Figure 7
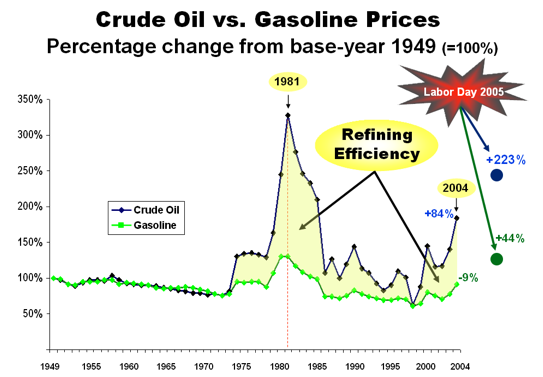
In the immediate aftermath of Katrina and Rita, a crude oil/gasoline price decoupling occurred, with the prices of oil products increasing disproportionately to crude costs. But the long-term trend has been just the opposite, owing to improving efficiencies and new best practices, such as processing lower crude-oil grades into high-grade products and importing semi-refined product. Specifically, Figure 8 measures both sets of prices in annual percentage terms from base-year 1949 and shows that gasoline prices have risen less than crude input costs. (Crude costs are the major determinant of oil-product prices.) In 2004, crude prices averaged 84% above their base, while gasoline prices were actually below base-year 1949. Labor Day 2005’s peak recorded crude prices were 223% above the base, while gasoline prices were only 44% above the base.
Figure 8
Part II: Domestic Refining Trends
A. Capacity Expansions: Past and Planned
The U.S. petroleum refining industry consists of 148 domestic refineries owned by 55 companies with an aggregate crude-oil processing capacity of about 17 million barrels per day. Since 1949, capacity has increased 170%, and oil distillation input tripled, while the number of operating refineries has decreased from 336 to 148 today. Expansion of aggregate capacity has occurred primarily at existing facilities rather than from the construction of new facilities. (The last major new refinery was built in 1976.) Only one new “greenfield” refinery has been built since 1990 (Petro Star Valdez, 1993), a fact that has been cited as evidence that a shortage of refining capacity exists in the United States. This view is simplistic and misleading, as discussed in Part IV below.
The drop in the number of domestic refineries has reflected three factors: declining domestic crude oil production, increasing economies of scale, and a removal of regulatory subsidies. Regarding the last point, regulatory programs subsidizing small and inefficient refiners caused 74 new facilities to come on stream between 1974 and 1979, only one of which was above 50,000 barrels per day. Many of the smaller refineries produced limited product slates—often with little or no gasoline. With the decontrol of the oil market in the early 1980s, much of this capacity was shuttered by 1985 [5].
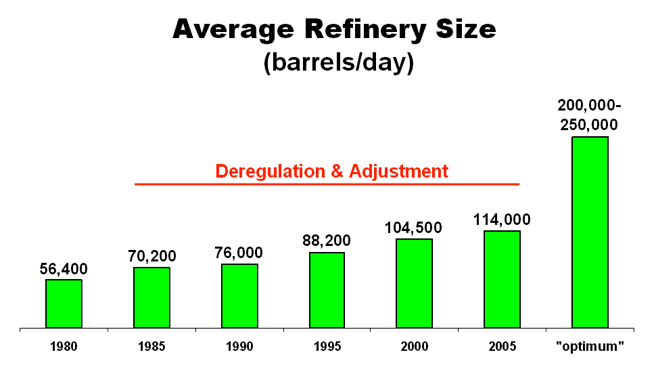
Figure 9 shows how the average size of refineries has grown since 1980 because of closures by undersized units and expansions by remaining ones. The average refinery today is still well below the economic optimum for new refineries, which can be as high as 200,000-250,000 barrels per day [6].
Figure 9
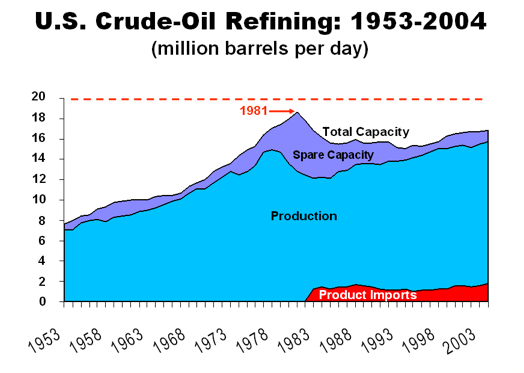
After reaching an all-time high of 18 million barrels per day (mmb/d) in 1981, the last year of the domestic oil boom, refinery capacity bottomed out at 15 mmb/d in 1994. In the eleven years since then, domestic capacity has grown approximately 15% to 17 mmb/d. This increase is the equivalent of 9 to 10 new refineries sized at 200,000 barrels per day.
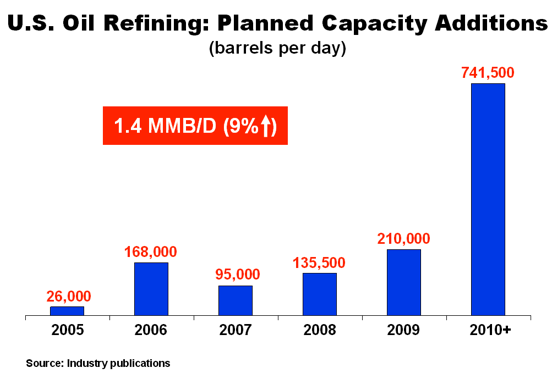
Refining capacity is expected to increase significantly in future years at home and abroad owing to higher margins and forecast growth in oil demand. Announced domestic capacity increases would raise domestic capacity by nearly 1.4 million barrels per day or 9% (see Figure 10).
Figure 10
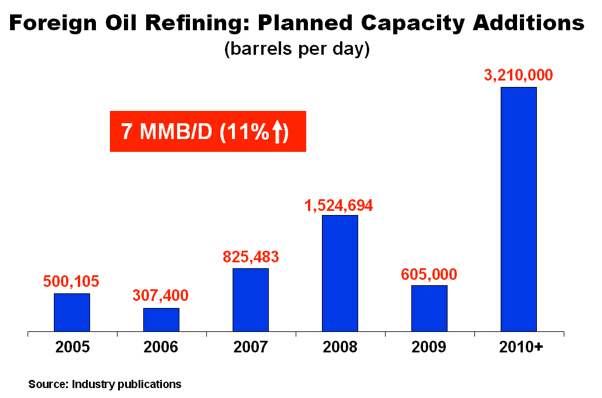
Foreign refining capacity is expected to increase even more, specifically, by 7 million barrels or 11% from current levels (see Figure 11).
Figure 11
The growth of domestic capacity has not kept up with domestic demand. Oil-product imports have bridged the gap. Figure 12 shows the aggregate domestic refining capacity, production, and product imports from 1982 through 2004. Tighter domestic capacity is responsible in part for higher margins, which has led to the announced refinery expansions. Higher utilization rates also reflect the use of information technology and improved reliability, which enables refiners to move to just-in-time inventory and lower costs for consumers.
Figure 12
International refining capacity is geographically distributed and is complemented by a distribution network that flexibly directs product cargos to the highest-valued market. This was confirmed in the aftermath of Katrina/Rita when gasoline imports substituted for much, but not all, of lost Gulf Coast refining capacity, as discussed in Part III below.
B. Increased Geographical Diversity
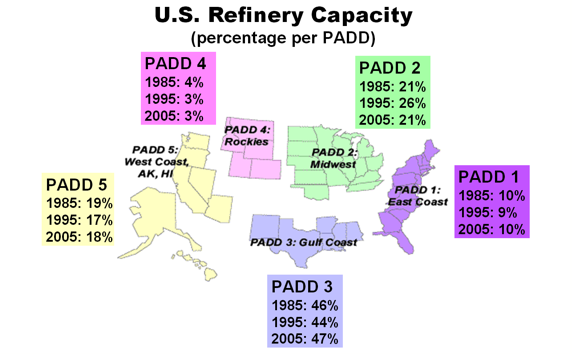
The recent spate of hurricane activity has focused attention on geographical diversity of the domestic refining industry. Members of Congress and the Bush administration have expressed concern that domestic refining capacity is too concentrated in the hurricane-prone Gulf Coast. Figure 13 shows the market share of U.S. refining capacity by Petroleum Allocation Defense District (PADD) in the two decades. Over 45% of all capacity is located in the Gulf Coast region, substantially unchanged from 1985. Capacity changes have generally followed population trends with the Midwest (PADD 2) losing market share to the East Coast (PADD 1), Gulf Coast (PADD 3), and West Coast (PADD 5).
Figure 13
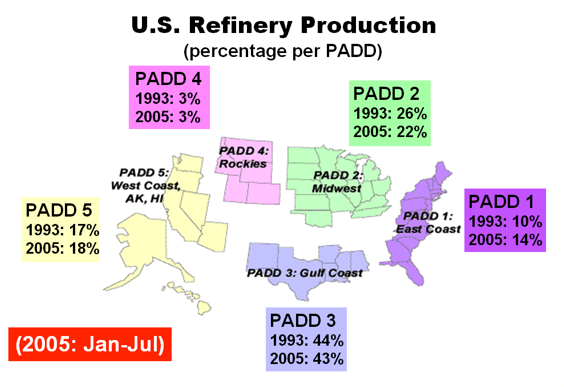
Looking at actual refinery production, the East Coast (PADD 1) area picked up market share from the Midwest (PADD 2) and Gulf Coast (PADD 3). PADD 5, the West Coast, also increased its percentage of the U.S. total, as seen in Figure 14.
Figure 14
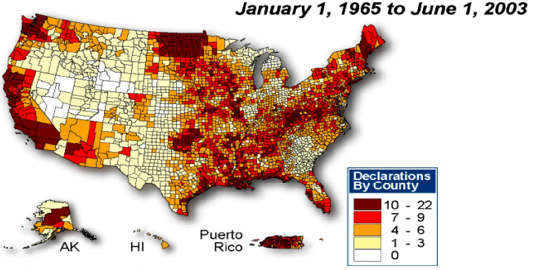
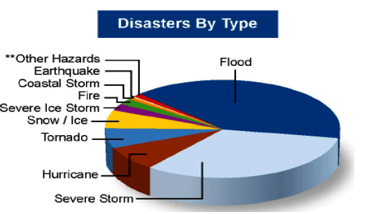
Every refinery in the country is susceptible to system failures, such as a regional power blackout or a major pipeline rupture. Each PADD is subject to unique national disasters, so any government initiative to ‘more evenly’ distribute capacity would not necessarily increase safety nor security of supply. PADD 5 is prone to earthquakes; northern portions of PADD 3 and southern portions of PADD 2 are subject to tornadoes; PADD 1 is also subject to hurricanes and, in the north, vicious ice storms and nor’easters. Figure 15 is a map of natural disasters nationwide since 1965 [7] along with the types of disasters. Refiners typically invoke special design and operational contingencies to protect their assets against such disasters to the extent practical and economic. Decisions to expand will also take in account estimated downtime from natural disasters of any kind.
Figure 15
It is also crucial to remember that refinery capacity follows crude production. That is, refining capacity is built close to major areas of crude oil supply—either production or crude import terminals. Because there have not been major new production areas developed in the last two decades, there has not been any reason for refining capacity to spring up in a new area.
C. Product Expansion/Differentiation
Modern refining is characterized by increasing economies of scale (discussed above), and increasing economies of scope. Refineries may produce more than three grades of gasoline and two grades of diesel; industry-wide, almost twice as many products are produced today than back in 1980.
Examples of new products are specialty solvents for making water-based paints, new fertilizers and pesticides for increased crop yields, and carbon-fiber composite materials used in lighter weight planes and automobiles for increased fuel efficiency.
Even the category “gasoline” is a complex set of individualized products, driven largely by air-quality regulation. Specifically, the Clean Air Act has proliferated specialty-fuel specifications and fuel-switching rules (i.e., oxygenate requirements), which have in turn led to different formulations of gasoline that refiners need to supply. While these formulations have likely contributed to improved air quality, the investments they required in facilities have consumed resources that otherwise might have been used to invest in added refinery capacity.
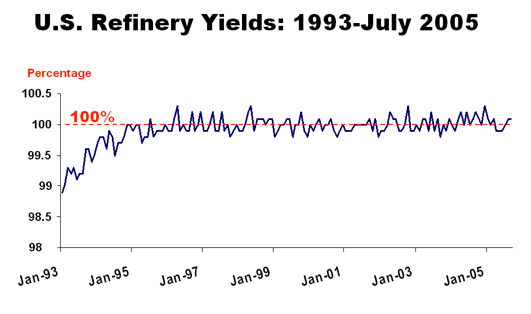
D. Higher Yields, Lowered Costs
U.S. refinery efficiency has increased and refinery yields have grown. Since 1995, refinery yields have increased by 2 percentage points [8,9], which is the equivalent of about 150,000 barrels per day of additional product. Approximately 47% of total yield is gasoline, with the remainder being diesel, jet fuel, asphalt, etc. The percent of total yield that is gasoline has increased over time.
Increased yields and product differentiation are accomplished by large-scale chemistry, including alkylation (making bigger molecules), cracking (making smaller molecules), rearranging (changing molecular structure), and other advanced and advancing techniques. Waste products have found use in new markets. The result has been an output-to-input yield factor above 100% [10] (see Figure 16).
Figure 16
Part III. Gasoline Imports and International Refining
Imports of refined petroleum products have grown from a trickle in the early 1970s to an important supplement to domestic supplies today. Oil is a global commodity. Refining is a major international industry. Not only crude oil but petroleum products are shipped by tanker to the most lucrative markets. In 2004, thirty-six countries shipped finished motor gasoline to the U.S., the top five being Canada, Virgin Islands, United Kingdom, Netherlands, and Venezuela. In 2005 through September, forty-four nations exported finished gasoline to the U.S. Next to the above five countries, the leading exporters this year to the U.S. have been Russia, Italy, Lithuania, France, Belgium, and Germany.
Figure 17 shows the steady increase of gasoline imports to 6% of total U.S. consumption.
Figure 17
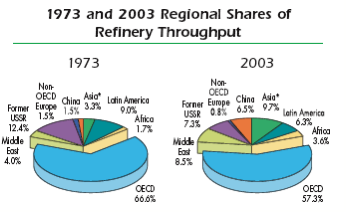
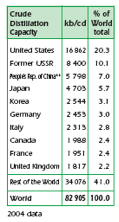
U.S. refining capacity represents about 20% of the world’s total. Global capacity is well diversified,
corresponding to major population centers, many in the Organization for Economic Cooperation and Development (OECD) countries (see Figure 18). World capacity has become more diversified as seen in Figure 19 [11]. Some major global refineries actively target the export market and, increasingly, U.S. demand.
Figure 18
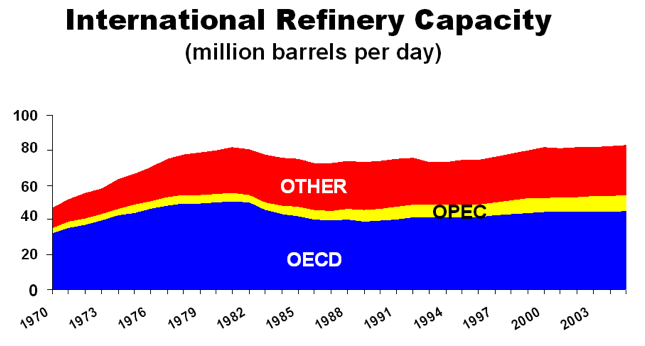
Figure 19
There is no particular reason to fear a cutoff of petroleum products, as some fear a cutoff of Middle Eastern crude oil. Refiners make their money by producing, not withholding. Nation-to-nation embargoes are easily circumvented by rearranged tanker transportation patterns in a global market. But traders must have the market signal to supply the markets most in need. This is a compelling reason for lawmakers to not impose price controls in times of emergencies, even in the name of preventing “price gouging.”
Part IV. New Refineries: What Will It Take?
A. Financial Issues
Financing and building a new refinery is a major endeavor. The new facility must capture economies of scale, which is estimated to be at or above 200,000 barrels per day. By comparison, a new refinery proposed by Arizona Clean Fuels would refine 150,000 barrels per day of crude oil at an estimated cost of $3.1 billion [12]. Among other products, 85,000 barrels per day of gasoline would be produced.
Investors must have a reasonable expectation of competitive returns. Assurance of profits, for this or any other new refinery, however, is hindered by two interrelated factors. First, it is difficult to execute long-term, fixed-priced contracts to lock-in crude-oil costs on one side and product revenues on the other. Secondly, variable crude-product relationships create very uncertain, cyclical margins. Thus big refineries entering the market are “spec” projects, requiring a high expected return to compensate for higher risk. All this puts pressure on the economics of the greenfield project. Not surprisingly, natural economics favor smaller and more numerous expansions at existing facilities to meet demand growth.
B. Siting Issues
In addition to the large capital investment required to bring a new refinery to fruition, numerous federal and state permits are required. Time is required first to acquire a permit, and then to construct. There is a new sense of urgency regarding domestic refinery capacity that promises to shorten the length of time to obtain permits, yet it will still take three to four years to build any new facility.
The difficulty of a new refinery competing against incremental expansions of existing facilities is indicated by the absence of the construction of a new unit on the site of a previously closed refinery. Existing “spots” have the potential for expedited permitting, infrastructure needs aside. Figure 20 shows the number of refinery closures by time period.
Figure 20
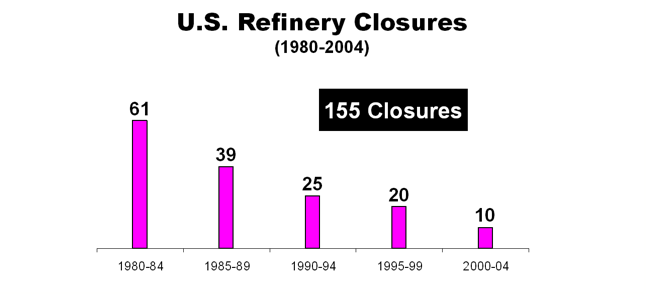
Since 1980, about 150 refinery sites that were once permitted and in operation have closed. The status of their permits is unknown, but it is not unreasonable to look at each one of those sites as a potential redevelopment (“brownfield”) opportunity. The fact that entrepreneurs have not put old sites into play with new facilities speaks to the fact that needs are being met with incremental expansions of existing facilities and imported products.
C. Cyclical Margins
Petroleum refining experiences a business cycle, with capacity utilization and profit margins varying over time. From 1985 to 2005, the average utilization factor for refineries increased from about 77% to more than 94% [13]. Utilization also varies month-to-month in response to the demands from summer driving and winter heating. Refinery utilization has been at or near peak capacity in recent years, lowering per-unit non-crude costs and increasing both overall resource efficiency and conversion. The decline in spare capacity also reflects competition from the product imports and the financial pressure created by required environmental-related investments.
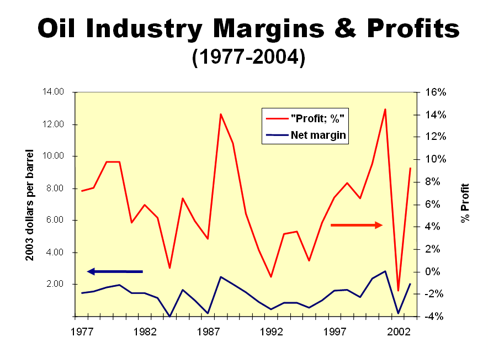
Refining has a long history of financial volatility. As stated in one study, published a half-century ago by Harvard University’s Graduate School of Business Administration, “both the monthly and yearly fluctuations in the refining gross margin in the period 1920–1952 were more violent than in the gross margins at any other level in the industry [14].” This has not changed, judging from the number of refinery closures since 1980, and most recently, the gyrations between crude-oil and product prices.
There are several ways to measure financial margins—gross operating margin per barrel processed, net margin, and profit margin. The volatility over the years suggests that focusing on profits in only one particular year is misleading. Figure 21 illustrates average financial margins for refineries from 1977 through 2004 [15]. Net margins should be viewed with the left Y-axis; profits with the right Y-axis.
Figure 21
Part V: Price “Gouging” and “Windfall” Profits
Market prices are objectively established by the actions of all market participants. The worldwide market in a commodity like oil involves many millions of individuals, from all walks of life, and in every corner of the globe. Consumers suffer when a sudden fall in supply increases prices, but this has been the exception and not the rule in the history of the petroleum market. Often the “problem” is for sellers, not buyers, as prices are falling and margins low. In such times consumers are quiet, and they come to expect a buyers’ market as normal.
There is no economic definition of “excessive” or “unconscionable” pricing, or “price gouging,” applicable to the wholesale or retail pricing of petroleum products. Neither is there a clear definition of windfall, much less obscene, profits [16]. These emotional, political terms should not mask what basic economics can say about pricing and profits.
Prices and profits can rise and be high for a period, but they can fall precipitously, as occurred in 1986 when crude oil prices fell by half and the earnings of America’s top 25 oil companies fell by one-third compared to the year before. In dollar terms, their net income of $11 billion for 1986 was two-third’s below 1980’s peak of $30 billion. To weather their financial storm, many independent producers and refiners called on Congress to impose crude oil and oil-product tariffs [17]. Such legislative price floors did not materialize, however. Lawmakers should keep in mind the cyclical nature of prices and profits in the oil industry, where world events and Mother Nature can drive major shifts in supply and demand.
Oil-product price increases in the wake of Katrina and Rita were due to the physical loss of refining capacity and the immobilization of related infrastructure. Prices had to go up to ration demand to less-available supply. The alternative of underpricing would have been angry motorists stuck in gasoline lines, panic purchasing (tank topping) by drivers concerned about being able to find gasoline the next time, and service-station closings. In a recent study, energy economist James Griffin calculated that the average American waiting an hour to buy gasoline is paying an extra $1 per gallon in terms of lost labor time [18]. Then there is the cost of uncertainty and stress that comes from not knowing if there will be gasoline at the front of the line, much less where the next tank of gasoline is going to come from.
The Federal Trade Commission recently testified that consumers are better off paying market prices than being “protected” by government price controls, including anti-gouging laws. “Price gouging laws that have the effect of controlling prices likely will do consumers more harm than good,” Chairman Deborah Platt Majoras testified. “While no consumers like price increases, in fact, price increases lower demand and help make the shortage shorter-lived than it otherwise would have been [19].” It is also difficult to define and enforce such statutes, Majoras added.
Underpricing at the pump would have sent a bad price signal to consumers (that there was more supply than there really was), producers (that gasoline was less valuable than it really was), and importers (that imports were less needed than they really were). The right prices, full scarcity prices, automatically translate into higher profits for refiners and other sellers. So arguing for lower profits is tantamount to demanding underpricing at wholesale and retail with its socially undesirable side effects.
Reality-based prices and profits, when they are high and when they are low, have an important role to play in the economic system. Government intervention capping prices or profits sends an economy-wide signal that capital is not safe in certain industries. It weakens capitalism. It tells investors that the downside is theirs and the upside is somebody else’s.
Part VI: Public Policy Conclusions
A. Interventionist Proposals
Since Katrina and Rita made landfall, and already-elevated gasoline prices got higher still, a plethora of legislative proposals have emerged. And the legislative debate has been quite different from that preceding the passage of the Energy Policy Act of 2005 the month before Hurricane Katrina made landfall. The newer legislative proposals have been mostly punitive.
Windfall Profit Tax
The Windfall Profit Tax of 1980 is widely considered to have been a failure. It discouraged domestic oil production, artificially encouraged imports, consistently raised less revenue than projected, was an administrative burden for industry and government, and was repealed in 1988 [20]. According to a recent study commissioned by the Investors Action Foundation, any reenactment of the WPT would impose billions of dollars in penalties on tens of millions of Americans who are savers and investors with portfolios containing stock in integrated oil companies [21]. To the extent that punitive taxation increases energy prices, which it will, poorer Americans will bear a disproportionate burden as well [22].
Recent oil-company profits are hardly out of line with other companies or industries as shown in Figure 22. Nonetheless, recent proposals to tax alleged windfall profits have emerged, such as levying a one-time tax on this year’s profits or enacting a standby levy if crude oil prices rise above a certain level (such as $40 per barrel). The tax would be added to the 35% corporate tax rate that applies to all industries.
Figure 22
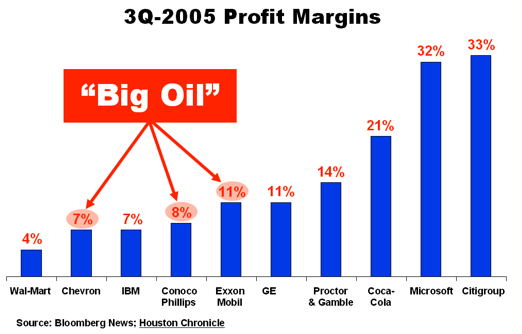
Oil-industry earnings in second-quarter 2005, an up quarter, were just below the average of all U.S. industries of 7.9%. Third-quarter earnings for the oil industry as a whole were also in line with other industrial sectors [23].
Any special tax penalizes the targeted industry. There is both the qualitative burden of dealing with a new levy and the quantitative burden of remitting the higher taxes to the U.S. Treasury. Energy expert Daniel Yergin questioned the propriety of such a levy:
What a windfall profits tax does is introduce a lot of distortions. It reduces investment, it increases a sense of political risk and it doesn’t achieve the goal that is intended, if it is to facilitate investment in new sources…. And this is a time when you want to increase and encourage investment, not provide disincentives to investment [24].
A windfall-profit tax is punishment for what some politicians consider bad behavior. It is hardly an incentive for good behavior (as politically defined). It is backward looking and penalizes oil companies, investors, and energy consumers counting on industry investment to ensure affordable, plentiful energy in the future.
Mandatory Set-Aside
Any law requiring refiners to hold extra product inventory is a hidden tax. It assumes that government planners know how much inventory is really needed to benefit consumers. It violates the practice of just-in-time inventory, which is a hallmark of modern business efficiency. It increases prices by taking supply off the market. It invites gaming by regulated companies that want to maximize profits under regulatory constraints. It discourages private, profit-maximizing inventory management, where supply is withheld in anticipation of higher prices in a real emergency. A government inventory requirement for petroleum also sets an unwelcome precedent for other industries.
Special Tax Subsidies
The Energy Policy Act of 2005 provided a special tax writeoff that works to lower the effective tax rate of domestic refiners below other industrial sectors. The new provision allows a company to expense, in the first year of operation, one-half of the cost associated with a new refinery or any capacity increase above 5 percent for an existing refinery. The tax incentive applies for increased capacity placed in service before 2012.
This provision, and certainly any new tax sweeteners, can excessively spur capacity additions, as occurred in the 1970s. Just as punitive intervention can artificially depress refining capacity, artificial incentives can result in industry overcapacity.
An equal-percentage tax rate with a minimum of special provisions, as long as the total tax burden is not increased, promotes neutrality among industrial sectors and companies making up each sector. Such a “flat tax” is fair and economically efficient compared to differential tax rates that create winners and losers. Special government favors for any industry create sentiment for special government penalties when conditions change, such as occurred between the summer and fall of 2005.
B. Pro-Market Reforms
Government at all levels can aid petroleum consumers by removing regulatory impediments. The process of issuing permits for new refineries can be expedited by common-sense reforms coordinating local, state, and federal requirements. However, grassroot refineries must overcome other obstacles, beginning with financing, to enter the market. As discussed above, expanding existing facilities can be very advantageous compared to beginning anew when such a huge financial bet cannot be backed by firm long-term contracts.
New supply basins would invite new grassroot refineries. A decision by Congress and state governments to open up new areas for exploration and production, particularly offshore, would diversify not only production but midstream and downstream infrastructure. New streams of crude oil from the Arctic National Wildlife Refuge (ANWR) would benefit PADD 5 in particular.
A recent study by the Federal Trade Commission identified government intervention, rather than free-market practices, as artificially increasing gasoline prices for consumers. A ban on self-service in two states, Oregon and New Jersey, has increased retail prices by as much as $0.05 per gallon, according to experts cited by the FTC [25]. Eleven states either ban “below-cost” sales or require a minimum markup on sales, both of which, the FTC summarized, “are likely to harm consumers [26].” Federally, the FTC criticized the Petroleum Marketing Practices Act, a federal statute which has frozen branded supplier-distributor relationships at 1978 levels. Such balkanization, the agency stated, “runs the risk that refiners will not be able to react in a timely manner to changing market conditions [27].” While noting that the average state tax is now $0.225 per gallon, the FTC warned that “higher gasoline taxes drive up the final price of gasoline [28].”
Conclusion
Elected representatives must explain to their constituents why high gasoline prices have occurred (high crude prices, refinery outages) and why such prices were essential to preventing service-station closures and gasoline shortages. Rather than play the blame game and support short-sighted interventionism, lawmakers should assure consumers that market processes work to return prices to more normal levels. The statistics are in. As the Energy Information Administration announced in a December 8 update, “U.S. Retail Gasoline Price Decreases for Ninth Straight Week [29].”
Populism and interventionism ruled in the 1970s to the great disadvantage of consumers and producers. The headlines from the price-controlled decade should not be forgotten: “Pentagon commandeers oil supplies” … “Truckers launch strike” … “Rationing program unveiled” … “Speed limit lowered” … “Sunday gasoline sale ban urged” … “Emergency fuel plan adopted” … “Odd-even rationing system spreads” … “Diesel fuel shortage begins” … “Sacrifices required from every sector” … “Reports of job layoffs” … “Industrial production off” … “20,000 gas stations closed [30].”
The populist response of enacting ever more regulation to replace failed regulation (illustrated in Figure 23) merely compounded problems. The nightmare began with President Nixon’s price-control order of August 1971, which, among many other distortions, led to petroleum product shortages before the Arab Embargo of October 1973 [31].
Figure 23
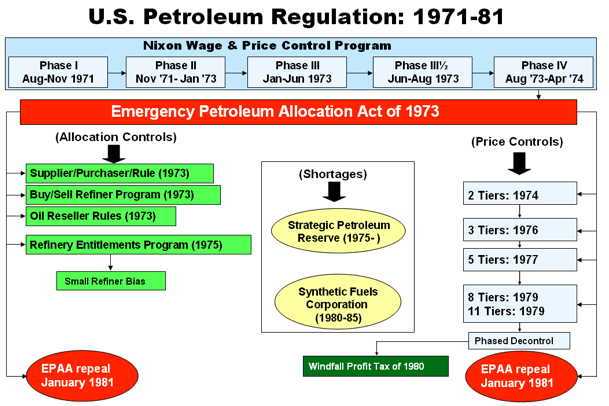
Both price controls and allocation controls took on a life of their own. The number of permitted ceiling prices for the same quality crude oil increased from two in 1974 to 11 by 1979, after which phased price decontrol began, tied to a windfall profits tax. (President Reagan in January 1981 ended price controls ahead of the scheduled phaseout, but the WPT continued until its repeal in 1988.) The distortions to refiners from multi-tier crude-oil price controls and supply problems lead to a variety of special-interest and redistributionist programs beginning in 1973. By the end, Sen. Edward Kennedy (D-Mass), a trenchant foe of the oil industry and supporter of price and allocation controls, complained about the “outrageous weed garden of regulation [32].”
Legislators, not to mention consumers and the oil industry, do not want to go down this road again. As successful as the market has been in the last two months in the face of hurricanes and global crude-oil uncertainties, there will be a proverbial next time. Another active hurricane season is predicted for 2006 [33], making the lessons from 2005 imperative. The recent lessons of the market must be learned, and the lessons from the 1970s never forgotten.
1. Unless otherwise noted, the oil- and refinery-related statistics in this paper are from the U.S. Energy Information Administration (Department of Energy), available at www.eia.doe.gov.
2. There have been debates over integrated versus nonintegrated industry structure but not oil-refining failure or underperformance in general.
3. Post-World War II labor problems caused President Truman to intervene to maintain national refinery production. See Robert Bradley, Jr. Oil, Gas and Government: the U.S. Experience (Lanham, MD: Rowman & Littlefield, 1996), pp. 1147-50.
4. EIA, “This Week in Petroleum,” November 16, 2005, p. 2, at http://tonto.eia.doe.gov/oog/info/twip/twiparch/051116/twipprint.html.
5. Robert Bradley Jr. The Mirage of Oil Protection (Lanham, MD: University Press of America, 1989), pp. 5, 81, 250–54.
6. This estimate is derived from a “next world-scale” oil refinery under construction in China that will be sized at 240,000 barrels per day. Morgan Stanley, “New Realities of Petroleum and the Economy: Revisited,” June 22, 2005, p. 29.
7. U.S. Federal Emergency Management Authority at http://www.fema.gov/library/images/dd-1964_gif.html.
8. Refinery yield, which is a volume measure, can exceed 100% owing to products that are less dense than crude inputs.
9. U.S. Energy Information Administration at http://tonto.eia.doe.gov/dnav/pet/pet_pnp_pct_dc_nus_pct_m.htm.
10. One primary example of such waste-to-use is petroleum coke used as electrodes in steel making.
11. International Energy Agency. Key World Energy Statistics, 2005. p. 24.
12. Nick Snow, “Firm Cheers Refining Bill,” Oil and Gas Journal, Oct. 17, 2005, p. 25
13. The utilization factor equals gross inputs to refining units divided by the operating/operable refining capacity of the units.
14. John McLean and Robert Haigh, The Growth of Integrated Oil Companies (Boston: Harvard University, 1954), p. 234.
15. U.S. Dept of Energy, Energy Information Administration, at http://www.eia.doe.gov/emeu/perfpro/fig05.html and http://www.eia.doe.gov/emeu/perfpro/fig06.html
16. Economics defines all profits as abnormal. “Profits are never normal,” Ludwig von Mises wrote. “Where there is normality, i.e., absence of change, no profits can emerge.” Mises, Human Action: A Treatise on Economics (Chicago: Contemporary Books, 1966), p. 350.
17. The Crash of 1986 and industry calls for protectionism are described in Robert Bradley, The Mirage of Oil Protection, chapter 1. The monetary figures for 1986 are approximately 75 percent higher when restated in today’s inflated dollars.
18. James Griffin, “Can Gasoline Markets be Trusted to Protect Consumers during Emergencies?” available at http://www.energyrealism.org/PriceGouging.pdf
19. Federal Trade Commission, “FTC Provides Joint Senate Committee Testimony on Gasoline Prices and Competition in the U.S. Petroleum Industry,” Press Release, November 9, 2005.
20. Salvatori Lazzari, “The Windfall Profit Tax on Crude Oil: An Overview of the Issues,” Congressional Research Service Report for Congress, 90-442 E, September 12, 1990, Summary.
21. Robert Shapiro and Nam Pham, “The Economic Impact of a Windfall Profits Tax for Savers and Shareholders,” November 2005, pp. 1–2. Available at http://www.windfallprofitstax.org/report.pdf.
22. In study in 2004 by the Congressional Black Caucus found that blacks on average dedicate 25% more of their income to energy than the average American family. National Commission on Energy Policy, Ending the Energy Stalemate, December 2004, p. 29.
23. Marlo Lewis Jr., “A Windfall of Bad Ideas,” Competitive Enterprise Institute, December 5, 2005, p. 4. Available at http://www.cei.org/gencon/019,05026.cfm
24. James Glassman, “Dan Yergin on Energy Prices and Policies,” Tech Central Station, October 27, 2005. Available at http://tcsdaily.com/article.aspx?id=102705E
25. FTC, Gasoline Price Changes: The Dynamic of Supply, Demand, and Competition, June 2005, p. 113. Available at http://www.ftc.gov/reports/gasprices05/050705gaspricesrpt.pdf
26. Ibid., p. 114.
27. Ibid.
28. Ibid., p. xiv.
29. EIA, “This Week in Petroleum,” December 7, 2005. Available at http://tonto.eia.doe.gov/oog/info/twip/twip.asp
30. Lester Sobel, ed. Energy Crisis: Volume 1, 1969–73 (New York: Facts on File, 1974), pp. 205, 218, 220, 229, 236; Lester Sobel, ed. Energy Crisis: Volume 2, 1974–75 (New York: Facts on File, 1975), pp. 55-56, 89; Lester Sobel, ed. Energy Crisis: Volume 3, 1975–77 (New York: Facts on File, 1977), p. 34; Lester Sobel, ed. Energy Crisis: Volume 4, 1977–1679 (New York: Facts on File, 1980), pp. 58, 61.
31. Robert Bradley Jr. Oil, Gas and Government: the U.S. Experience, pp. 1623, 1787.
32. Ibid., pp. 1787–88.
33. National Oceanic and Atmospheric Administration, “NOAA Reviews Record-Setting 2005 Atlantic Hurricane Season: Active Hurricane Era Likely To Continue,” November 29, 2005, at http://www.noaanews.noaa.gov/stories2005/s2540.htm; Philip J. Klotzbach and William M. Gray, “Extended Range Forecast of Atlantic Seasonal Hurricane Activity and U.S. Landfall Strike Probability for 2006,” December 6, 2005, at http://hurricane.atmos.colostate.edu/forecasts/2005/dec2005/
Bibliography
1. Bradley, Robert. The Mirage of Oil Protection (Lanham, MD: University Press of America, 1989)
2. Bradley, Robert. Oil, Gas and Government: the U.S. Experience (Lanham, MD: Rowman & Littlefield, 1996)
3. Glassman, James. “Dan Yergin on Energy Prices and Policies,” Tech Central Station, October 27, 2005 Available at http://tcsdaily.com/article.aspx?id=102705E
4. Griffin, James. “Can Gasoline Markets be Trusted to Protect Consumers during Emergencies?” available at http://www.energyrealism.org/PriceGouging.pdf
5. International Energy Agency. Key World Energy Statistics, 2005
6. Klotzbach, Philip J. and Gray, William M. “Extended Range Forecast of Atlantic Seasonal Hurricane Activity and U.S. Landfall Strike Probability for 2006,” December 6, 2005, at http://hurricane.atmos.colostate.edu/forecasts/2005/dec2005/
7. Lazzari, Salvatori. “The Windfall Profit Tax on Crude Oil: An Overview of the Issues,” Congressional Research Service Report for Congress, 90-442 E, September 12, 1990
8. Lewis, Marlo, Jr. “A Windfall of Bad Ideas,” Competitive Enterprise Institute, December 5, 2005. Available at http://www.cei.org/gencon/019,05026.cfm
9. McLean, John and Haigh, Robert. The Growth of Integrated Oil Companies (Boston: Harvard University, 1954)
10. Mises, Ludwig von. Human Action: A Treatise on Economics (Chicago: Contemporary Books, 1966)
11. Morgan Stanley. “New Realities of Petroleum and the Economy: Revisited,” June 22, 2005
12. National Commission on Energy Policy, Ending the Energy Stalemate, December 2004. Available at http://www.energycommission.org/ewebeditpro/items/O82F4682.pdf
13. National Oceanic and Atmospheric Administration, “NOAA Reviews Record-Setting 2005 Atlantic Hurricane Season: Active Hurricane Era Likely To Continue,” November 29, 2005, at http://www.noaanews.noaa.gov/stories2005/s2540.htm
14. Shapiro, Robert and Pham, Nam. “The Economic Impact of a Windfall Profits Tax for Savers and Shareholders,” November 2005. Available at http://www.windfallprofitstax.org/report.pdf
15. Snow, Nick. “Firm Cheers Refining Bill,” Oil and Gas Journal, Oct. 17, 2005
16. Sobel, Lester, ed. Energy Crisis: Volume 1, 1969–73 (New York: Facts on File, 1974)
17. Sobel, Lester, ed. Energy Crisis: Volume 2, 1974–75 (New York: Facts on File, 1975)
18. Sobel, Lester, ed. Energy Crisis: Volume 3, 1975–77 (New York: Facts on File, 1977)
19. Sobel, Lester, ed. Energy Crisis: Volume 4, 1977–79 (New York: Facts on File, 1980)
20. U.S. Energy Information Administration. “This Week in Petroleum,” various issues
21. U.S. Federal Emergency Management Authority at http://www.fema.gov/library/images/dd-1964_gif.html
22. U.S. Federal Trade Commission, Gasoline Price Changes: The Dynamic of Supply, Demand, and Competition, June 2005 at http://www.ftc.gov/reports/gasprices05/050705gaspricesrpt.pdf
23. U.S. Federal Trade Commission, “FTC Provides Joint Senate Committee Testimony on Gasoline Prices and Competition in the U.S. Petroleum Industry,” Press Release, November 9, 2005
