
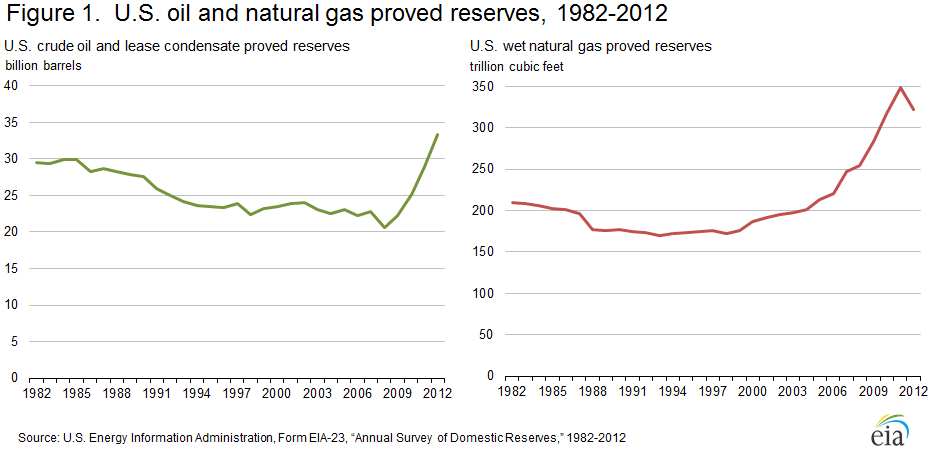
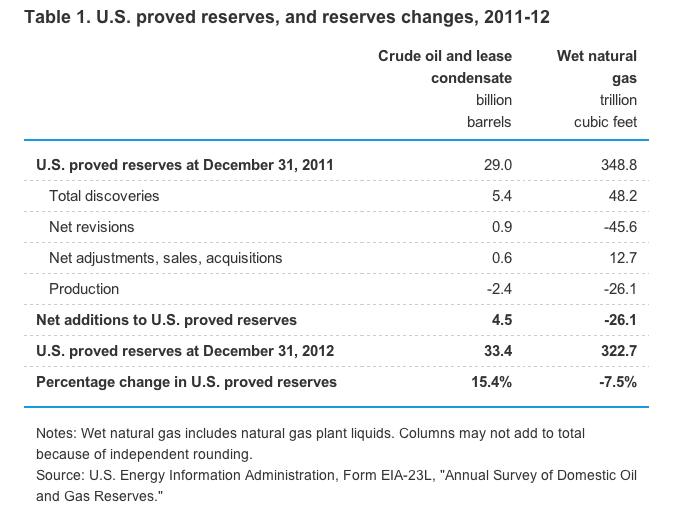
The Energy Information Administration recently reported that U.S. crude oil proved reserves[1] rose for the fourth consecutive year in 2012, increasing by over 15 percent to 33 billion barrels.[i] U.S. crude oil and lease condensate[2] proved reserves on January 1, 2013 were the highest since 1976, and the increase of 4.5 billion barrels in 2012 was the largest annual increase since 1970. The increase in crude oil reserves was due to increased exploration for liquid hydrocarbons and improved technology for developing shale oil plays incentivized by relatively high oil prices. The average price of oil remained relatively constant in 2012 at an average daily spot price of $95 per barrel. Natural gas reserves, on the other hand, declined in 2012 by 7.5 percent from a very high level the year before. Lower prices for gas meant businesses were dis-incentivized from exploring and drilling for natural gas when compared to oil.
Source: Energy Information Administration, http://www.eia.gov/naturalgas/crudeoilreserves/index.cfm
U.S. Oil Proved Reserves
The large gain in U.S. oil reserves was due in part to shale oil (tight oil) plays, which contain conventional oil that is accessed through hydraulic fracturing and horizontal drilling. Shale oil accounted for 7.3 billion barrels (22 percent) of the total proved reserves of crude oil and lease condensate in 2012.
Proved crude oil reserves in the Eagle Ford shale oil play in southwest Texas surpassed those in the Bakken Formation of North Dakota to become the largest shale oil play in the United States. Texas was responsible for the largest volumetric increase (3.0 billion barrels) in proved oil reserves because of development in the Permian and Western Gulf basins. North Dakota had the second-largest increase (1.1 billion barrels) from development of the Bakken and Three Forks formations in the Williston Basin. In 2012, North Dakota’s proved reserves of crude oil and lease condensate exceeded those of Alaska and California, making North Dakota the second largest oil reserve state in the United States. Collectively, North Dakota and Texas accounted for 92 percent of the net increase in total U.S. proved oil reserves in 2012. The federal offshore region of the Gulf of Mexico added 137 million barrels (3 percent of the net increase) of new reserves.
Natural Gas Proved Reserves
U.S. natural gas proved reserves decreased by 26 trillion cubic feet to 323 trillion cubic feet in 2012 from 349 trillion cubic feet the year before due to low natural gas prices.[ii] Despite the fact that the 2012 decline interrupted a 14-year trend of consecutive increases in natural gas proved reserves, the 323 trillion cubic feet was the second highest amount since 1977, the earliest date that EIA has recorded reserve data in its Annual Energy Review. This phenomenon of lower reserves due to lower prices demonstrates clearly that the metric for determining “proved reserves” is not solely a physical matter of supply, but includes economics. The old saying in the oil patch that “there’s a lot more oil at $50 per barrel than there is at $10 per barrel” merely reflects the reality that if oil or natural gas costs more to produce than it is worth, it will not get produced, and therefore, the reserves are “unproven” below a certain price level.
The average spot price of natural gas at the Henry Hub between 2011 and 2012 declined by 34 percent, causing large negative net revisions to the reserves of existing fields that offset almost entirely the gains from extensions of existing fields. EIA anticipates that natural gas proved reserves for 2013 will likely increase due to the recovery in natural gas prices from 2012 to 2013.
Proved natural gas reserves in the Marcellus Shale gas play in Pennsylvania and West Virginia surpassed those in the Barnett Shale play of Texas to become the largest shale gas play in the United States. Among the states, Texas had the highest level of proved natural gas reserves, followed by Pennsylvania.
[1] Proved reserves are volumes of oil that geological and engineering data demonstrate with reasonable certainty to be recoverable in future years from known reservoirs under existing economic and operating conditions.
[2] EIA defines lease condensate as “Light liquid hydrocarbons recovered from lease separators or field facilities at associated and non-associated natural gas wells. Mostly pentanes and heavier hydrocarbons. Normally enters the crude oil stream after production.”
[i] Energy Information Administration, Crude oil reserves at start of 2013 reach highest level since 1976, April 10, 2014, http://www.eia.gov/dnav/pet/pet_crd_cplc_dcu_rusf_a.htm
[ii] Energy Information Administration, U.S. Crude Oil and Natural Gas Proved Reserves, April 10, 2014, http://www.eia.gov/naturalgas/crudeoilreserves/index.cfm
