
The Energy Information Administration (EIA) reports that U.S. liquid fuels production growth, led by oil production growth, has more than offset unplanned disruptions to the world’s oil supply. U.S. liquid fuels production, including crude oil, hydrocarbon gas liquids, biofuels, and refinery processing gain, increased by more than 4.0 million barrels per day between January 2011 and July 2014. In comparison, Canada produces about 4.0 million barrels of oil a day.
The increase in crude oil production from January 2011 to July 2014 was 3.0 million barrels per day or about 75 percent of the increase in U.S. liquid fuels production, surpassing the global unplanned supply disruptions of 2.8 million barrels per day. That increased production is unprecedented, and has kept world oil prices in check as depicted in the graph below[i] even with the trouble with ISIS, the Gaza situation, and Russia’s slow-motion invasion of Ukraine. This positive effect on world markets would be even more impactful but for government lands, where oil production has declined.
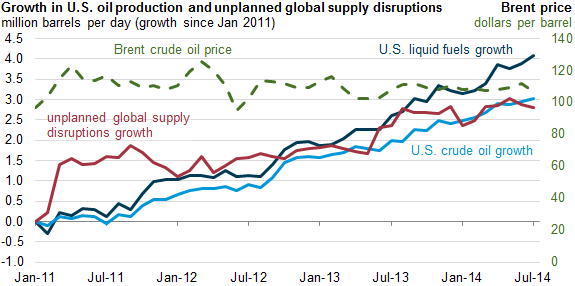
Source: Energy Information Administration, http://www.eia.gov/todayinenergy/detail.cfm?id=17731
As EIA explains, “U.S. production growth, the main factor counterbalancing the supply disruptions on the global oil market, has contributed to a decrease in crude oil price volatility since 2011.“ The monthly average Brent price of oil ranged between $107 per barrel and $112 per barrel over the past 13 months (a $5 per barrel range) compared to a $21 per barrel range during the prior 13-month period (June 2012-June 2013).
U.S. Oil Production Growth to Continue Through 2019
The EIA in its International Energy Outlook 2014 expects U.S. crude and lease condensate production to increase through 2019, peaking at 9.9 million barrels per day—equal to the 1970 historical U.S. high level of production.[ii] Continued development of tight oil resources in the Bakken, Eagle Ford, and Permian Basin shale formations leads to increased onshore production. U.S. tight oil production increases to 4.8 million barrels per day in 2021 (5.3 times higher than in 2010) and then declines to 3.2 million barrels per day in 2040 as EIA believes depletion effects will reduce production from these high-productivity areas. The agency does note that there is a high level of uncertainty in this forecast as exploration, appraisal, and development programs are expanding operator knowledge about producing reservoirs, which could result in additional tight oil resources.
U.S. offshore oil production is expected to range between 1.4 and 2.0 million barrels per day through 2040. Because the pace of exploration and production activity quickens towards the end of the projection period, new large development projects associated predominantly with discoveries in the deepwater and ultra-deepwater portions of the Gulf of Mexico are brought on stream. Also, new offshore oil production from the Alaska North Slope is expected to partially offset the decline in production from onshore North Slope fields.
While the largest new supplies of tight oil come from the United States, a few other countries, including Canada, Mexico, Russia, Argentina, and China, are expected to begin producing significant volumes of tight oil. (See graph below.)
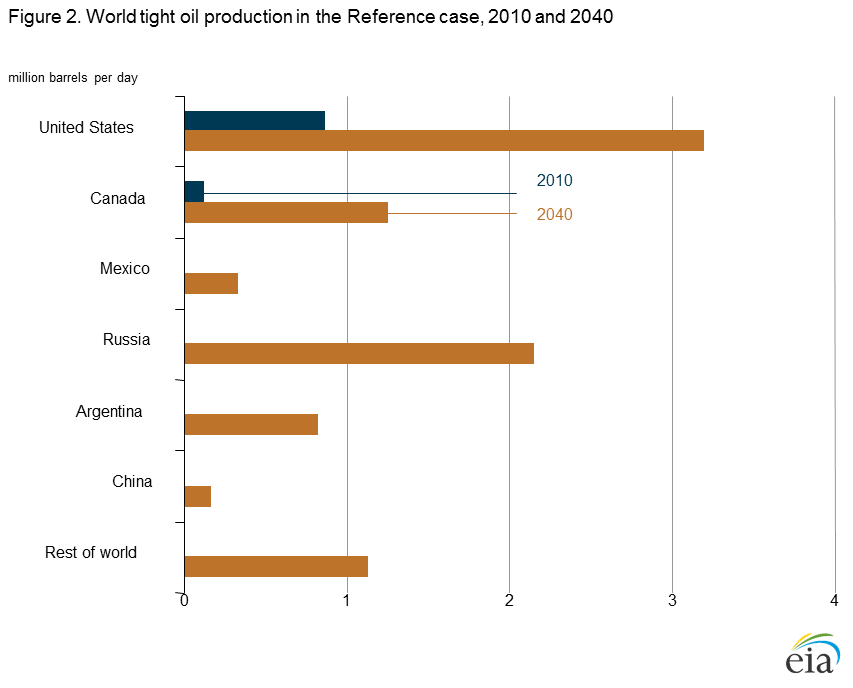
Source: EIA, International Energy Outlook 2014, http://www.eia.gov/forecasts/ieo/more_overview.cfm
EIA assumes that OPEC will continue to maintain its share of the world oil production market, making investments in incremental production capacity so that total OPEC oil production remains between 39 and 44 percent of total world production. It is also assumed in the forecast that no geopolitical events will cause prolonged supply shocks in the OPEC countries that could limit production growth. The expectation from these assumptions is that world oil prices will trend downward, from $113 per barrel in 2011 to about $92 per barrel in 2017, and then increase to $141 per barrel in 2040.
Oil Demand in the International Energy Outlook
EIA expects that world liquid fuels consumption will grow from 87 million barrels per day in 2010 to 119 million barrels in 2040—a 38 percent increase (4 percent higher than in last year’s forecast). Oil demand growth is expected to come mainly from the developing world, principally Asia and the Middle East, as liquid fuel demand in the United States, Europe and other developed regions is expected to have peaked from energy efficiency efforts and fuel switching. Developing Asian countries, including China and India, are expected to make up 72 percent of the increased oil demand.

Source: EIA, International Energy Outlook 2014, http://www.eia.gov/forecasts/ieo/more_overview.cfm
The share of world liquid fuels consumption by non-OECD countries is expected to grow from 47 percent of the market in 2010 to 63 percent in 2040. Non-OECD Asia increases its liquid fuels consumption by 23.4 million barrels per day between 2010 and 2040, with China accounting for 10.7 million barrels per day of the total increase. As China’s economy moves from energy-intensive industrial manufacturing to service industries, the transportation sector becomes a significant source of growth in the country’s liquid fuels use, more than doubling its consumption of liquid fuels from its level in 2010. By 2035, China overtakes the United States as the world’s largest consumer of liquid fuels. (See figures below.)

Source: EIA, International Energy Outlook 2014, http://www.eia.gov/forecasts/ieo/more_overview.cfm

Source: EIA, International Energy Outlook 2014, http://www.eia.gov/forecasts/ieo/more_overview.cfm
Conclusion
U.S. oil production is keeping oil price increases at bay as it exceeds the amount of unplanned oil production disruptions in the world. This is impressive given the unrest in the Middle East and with Russia, and is remarkable given that on government lands, production is actually down. But, although U.S. oil production growth is expected to increase until 2019, and remain strong thereafter, it will not be able to meet the increased global demand levels expected in the future, principally from the developing countries in Asia and the Middle East, which are expected to represent 85 percent of the increased liquid fuels demand. As a result, world oil prices are expected to increase to $141 per barrel by 2040.
The United States could contain these price increases further by allowing access to federal areas onshore in the lower 48 states, offshore in the Gulf of Mexico and off the coasts of the Atlantic and Pacific oceans, in Alaska, and in the Arctic that the Obama Administration has so successfully kept out of lease sales despite those areas being opened by Congress in 2008. Since the Obama Administration has taken office, gasoline prices have doubled. When President Obama took office in January 2009, nationwide gasoline prices for regular fuel blends averaged $1.84 per gallon; in May 2011, during the president’s first term, that price had increased to $3.96 a gallon.[iii] While gasoline prices have come down below $3.50 per gallon, a AAA poll conducted in April, shows that 50 percent of drivers said that gas prices were “too high” when they reached $3.30 a gallon, and 65 percent felt $3.50 was too high.[iv]
[i] Energy Information Administration, U.S. liquid fuels production growth more than offsets unplanned supply disruptions, August 27, 2014, http://www.eia.gov/todayinenergy/detail.cfm?id=17731
[ii] Energy Information Administration, International Energy Outlook, September 9, 2014, http://www.eia.gov/forecasts/ieo/more_overview.cfm
[iii] National Journal, Republicans Say Gas Prices Are Rising. They’re Not., September 7, 2014, http://www.nationaljournal.com/energy/republicans-say-gas-prices-are-rising-they-re-not-20140907?ref=energy_edge
[iv] AAA Newsroom, High Gas Prices No Longer Fueling a Decline in American Driving, April 3, 2014, http://newsroom.aaa.com/2014/04/high-gas-prices-no-longer-fueling-a-decline-in-american-driving/
