
What is the Solar Investment Tax Credit?
Over the last several decades, the U.S. solar industry has benefited from generous subsidies and mandates. In 2014 alone, solar companies and homeowners claimed near $3 billion in solar tax credits. But despite billions of dollars of subsidies, solar power remains among the most expensive and scarce sources of electricity. For example, in 2020 electricity from photovoltaic solar (solar PV) is still projected to cost more than three times what electricity from existing coal and nuclear plants costs today.
The ITC props up an industry that would likely struggle without massive subsidies. The ITC, like the electric vehicle tax credit and the property credit for weatherizing homes, typically benefits the wealthy[i] and increases the cost of electricity for those that rely on the grid for power. If the federal subsidies for solar power remain in place indefinitely, solar power threatens to strain the power grid, potentially causing dangerous power fluctuations and increasing the risk of blackouts. These grid problems are already looming in solar-heavy areas like California and Hawaii.
As we explain below, the solar ITC is an expensive federal handout that primarily benefits the wealthy at the expense of all taxpayers; it raises the cost of generating electricity; and it threatens to disrupt the electric grid.
Legislative History
What people typically call the ITC is actually two separate tax credits, the investment tax credit for commercial properties,[ii] and the residential energy efficient property credit,[iii] or residential ITC. Congress enacted the original residential and commercial ITCs in the aftermath of the Arab oil embargo. The residential tax credit expired a decade later in 1985.[iv] The commercial ITC was extended seven times and was set at a permanent 10 percent rate in 1992.[v]
The Energy Policy Act of 2005 raised the commercial ITC to a temporary 30 percent rate and reinstated the residential ITC after a 20-year hiatus.[vi] The residential ITC was capped at a $2,000 benefit for photovoltaic (PV) solar installations and was scheduled to retire at the end of 2007. The tax break was again extended for a year, and the Emergency Economic Stabilization Act extended the credits for eight years and removed the cap on PV benefits.[vii] The American Recovery and Reinvestment Act of 2009 removed the remaining $2,000 cap in the residential credit for solar water heating technology for property installed after December 31, 2008.[viii]
The residential ITC is due to expire on December 31, 2016, while the commercial ITC will drop from a 30 percent rate to a permanent rate of 10 percent on January 1, 2017.[ix] All projects need to be operational before the December 31, 2016 deadline to receive the credit.
The Solar Investment Tax Credit Subsidizes Expensive Electricity
Despite claims of the imminent cost-competitiveness of solar, new PV systems will remain among the most expensive sources of electricity for the foreseeable future, according to the Energy Information Administration’s 2015 Annual Energy Outlook.[x]
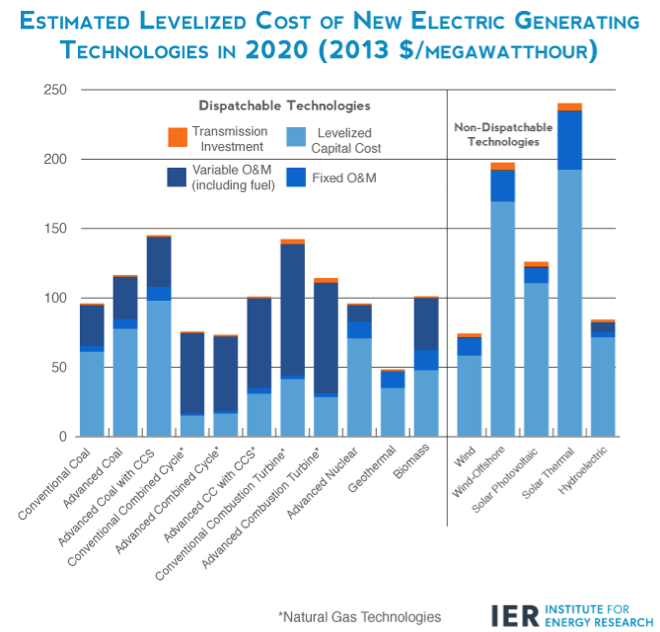
Newly installed utility-scale solar PVs are projected to cost $125.3 ($2013) per MWh and solar thermal is expected to cost $239.7/MWh—compared to new conventional coal ($95.1/MWh) new natural gas-fired conventional combined cycle ($75.2/MWh) and new advanced nuclear ($95.2/MWh).[xi]
A study financed by First Solar, a PV manufacturer, examined solar PV costs in Colorado and estimated that electricity produced by residential PV will be even more expensive than utility-scale solar plants. Residential solar arrays are projected to generate electricity at a cost of $167/MWh and $182/MWh in 2019—higher than the cost of every conventional fuel under EIA’s projections.[xii]
The price gap between electricity generated from new solar panels compared to existing conventional fuel plants is even wider. On average, existing coal plants produce electricity at $38.4/MWh, while existing nuclear plants generate electricity at $29.6/MWh on average, according to a recent study commissioned by the Institute for Energy Research.[xiii] Electricity from new solar PV is, on average, three times more expensive than existing coal and four times more expensive than existing nuclear.[xiv]
Even if solar power does eventually reach “grid parity,” i.e., cost-competitiveness with existing sources of electricity, it cannot provide the same services as more reliable sources of power.[xv] People will always demand power in patterns that do not match up neatly with the output of solar facilities. Thus, a “dispatchable” or on-demand source of electricity will always be needed in order to satisfy demand. Solar power is a non-dispatchable technology. It therefore belongs in a separate, less valuable class of electricity production.
Cost to Taxpayers
The solar industry has received billions of dollars from the two major federal tax credits used by solar producers, including Section 48 for the commercial ITC and section 25(d) for the residential ITC. Spending on both the residential and commercial credit has increased dramatically in the last six years. For 2014 alone, expenditures on the commercial ITC reached $1.8 billion and the residential ITC topped $1 billion—seven times higher than in 2009.[xvi] [xvii]
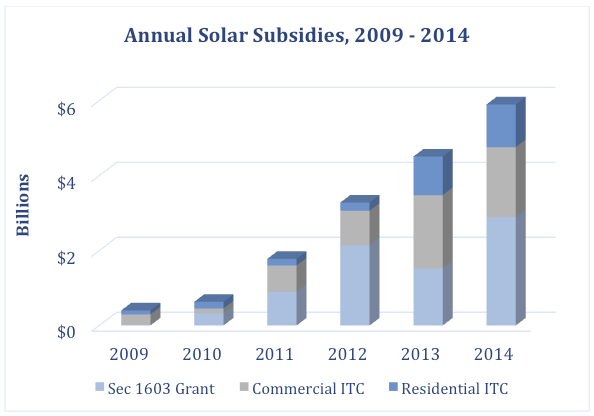
Source: President’s Budget Analytical Perspectives, Various Issues, Office of Management and Budget, and the Internal Revenue Service.
The American Recovery and Reinvestment Act of 2009 included a provision that allowed those eligible for the ITC to claim a cash grant instead of a tax deduction if they began construction on a solar property between 2009 and December 2012, called the Section 1603 grant program.[xviii] About $8.6 billion has been paid out to solar developers since 2009, and the Treasury will continue to pay benefits out until the end of 2016.[xix]
From 2009 to 2014, the government spent $18 billion on the three major subsidies and tax expenditures for solar system installations (Section 1603 grant and residential and commercial ITC).[xx] Yet after billions of dollars of subsidies, solar power still comprises less than 1 percent of U.S. electricity generation.
Market-Distorting Subsidies
Across the globe, grid-connected solar power is a political animal. The European Photovoltaic Industry Association (EPIA) has made PV installation forecasts for 30 years and harbors no illusions about the role of subsidies: “PV remains a policy-driven business, where political decisions considerably influence potential market takeoff or decline,” according to the EPIA’s Global Market Outlook for 2014-18.[xxi] In other words, growth in solar is tied to government policy and not markets; sales grow rapidly when subsidies are available and end when they expire.
A 2011 Congressional Research Service (CRS) Report criticized both the ITC and the Section 1603 grants as “economically inefficient,” writing, “paying for subsidies requires the government to raise funds elsewhere. If these funds are raised through a distortionary tax, such as a tax on labor, such subsidies are economically inefficient.”[xxii]
The United States’ solar industry has never had its training wheels taken off by the government. Solar production depends on cash grants, tax credits, and other preferential treatment provided by states and the federal government. Americans will continue to pay for the solar industry’s multi-billion-dollar lifeline until policymakers decide to cut it.
Threats to the Grid
Grid reliability has become increasingly tenuous as subsidized solar installations comprise a larger share of total generating capacity. Solar energy is intermittent—it can only be produced while the sun is shining and completely ceases to power the grid at night. Solar energy is also inherently unpredictable, as storms and poor weather could result in increased demand for electricity that the solar unit will be unable to meet. Unlike conventional power sources that produce electricity around the clock and can increase or decrease output on demand, the amount of energy produced by a solar installation cannot be fine-tuned by a grid operator and can change in a moment due to a passing cloud, posing a threat to grid reliability.[xxiii]
Solar PV generation is highest midday and ceases generating during the peak hours in the evening. To meet peak demand despite the fall-off of solar output, conventional fuel plants must rapidly “ramp up” production to meet demand, which puts an enormous amount of strain on these plants and leads to inefficient energy production and increased equipment failure.[xxiv] This is, in part, why increasing the amount of solar PV production increases the likelihood of fluctuations in voltage.[xxv] Hence the areas with higher concentrations of distributed solar PV systems are the most vulnerable to disruptions in generation.[xxvi]
Conclusion
Solar energy has been propped up by lavish government subsidies for decades. The commercial ITC has been available to the solar industry for 37 years, and together with the residential ITC, have paid out tens of billions to dollars to companies for expensive and unreliable energy. It is long past time for Congress to let these subsidies expire. If Congress does let the ITC expire, it would result in lower electricity prices, less cost to taxpayers, less harm to lower-income customers, and a more reliable power grid.
[i] Severin Borenstein and Lucas W. Davis, The Distributional Effects of U.S. Clean Energy Tax Credits, Working Paper 21437, National Bureau of Economic Research, July 2015, http://www.nber.org/papers/w21437.pdf.
[ii] The commercial ITC provides a non-refundable tax credit equal to 30 percent of expenditures on a solar energy system in operation before the end of the tax year. There is no maximum credit, and the ITC can be applied against total income taxes owed. If the full credit cannot be claimed due to a limited tax liability, an amended return for the prior tax year can be filed with the Internal Revenue Service (IRS) for a potential refund. If the credit is still unused after carrying it back one year, it can be applied to each of the 20 tax years following the activation of the credit. There is a five-year compliance period in which the credit’s beneficiaries must retain ownership of the property or the credit is subject to recapture.
[iii] The residential ITC can be claimed for expenditures on solar energy properties placed in service at a new or existing home during the taxable year.[iii] IRS guidance requires the owner to reduce the basis of their home by the amount of credit allowed.[iii] Any unused portion of the credit can be applied against the following year’s tax liability.
[iv] Robert S. McIntyre, Lessons for Tax Reformers from the History of the Energy Tax Incentives in the Windfall Profit Tax Act of 1980, 22 B.C.L. Rev. 705, pp. 715 (1981), http://lawdigitalcommons.bc.edu/bclr/vol22/iss4/2.
[v] P.L. 102-486 (Title XIX)(subtitle A)(sec. 1916)
[vi] Energy Policy Act of 2005, (P.L. 109-58)(Title XIII) (subtitle C)(sec. 1337)(a)(A)(i), http://www.gpo.gov/fdsys/pkg/PLAW-109publ58/pdf/PLAW-109publ58.pdf
[vii] SEIA, “Solar Investment Tax Credit (ITC), Factsheet, accessed November 17, 2015, http://www.seia.org/policy/finance-tax/solar-investment-tax-credit.
[viii] American Recovery and Reinvestment Act of 2009, (P.L. 115-5)(Division B)(Title I)(sec. 1122)(a)
[ix] 26 USC § 25D(g) and 26 USC § 48(a)(2)(A)(i)(II)
[x] Energy Information Administration, “Levelized Cost and Levelized Avoided Cost of New Generation Resources in the Annual Energy Outlook 2015,” June 3, 2015, http://www.eia.gov/forecasts/aeo/electricity_generation.cfm.
[xi] Ibid.
[xii] Bruce Tsuchida, et al., “Comparative Generation Costs of Utility-Scale and Residential-Scale PV in Xcel Energy Colorado’s Service Area, The Brattle Group, July 2015, http://brattle.com/system/publications/pdfs/000/005/188/original/Comparative_Generation_Costs_of_Utility-Scale_and_Residential-Scale_PV_in_Xcel_Energy_Colorado%27s_Service_Area.pdf?1436797265.
[xiii] Thomas Stacy, “The Levelized Cost of Electricity from Existing Generation Resources,” Institute for Energy Research, June 2015, http://americanenergyalliance.us2.list-manage1.com/track/click?u=7cbc7dd79831a84c870f9842e&id=5bad2ac3b6&e=a946c025cc.
[xiv] Ibid.
[xv] Mark Febrizio, “Why ‘Grid Parity’ Is a Meaningless Concept,” Institute for Energy Research, November 26, 2014, https://www.instituteforenergyresearch.org/grid-parity-meaningless-concept/.
[xvi] President’s Budget Analytical Perspectives 2016.
[xvii] The tax estimates for section 25(d) include credits for other renewable technologies, and does not separate the losses due to specific technologies. But, under the law, solar has the highest available deductions by having no cap on the amount a beneficiary can receive, and includes the broadest definition of what type of solar technology can apply for a deductions.
[xviii] IRS, “Notice 2014 – 39, Section 1603 Sequestration and Its Effect on the Investment Tax Credit and the Production Tax Credit,” June 23, 2014, http://www.irs.gov/irb/2014-26_IRB/ar09.html.
[xix] U.S. Department of the Treasury, “Overview and Status Update of the §1603 Program,” August 3, 2015, http://www.treasury.gov/initiatives/recovery/Documents/STATUS%20OVERVIEW.pdf.
[xx] President’s Budget Analytical Perspectives 2016.
[xxi][xxi] Gaetan Masson, Sinead Orlandi, and Manoel Rekinger, “Global Market Outlook for Photovoltaics: 2014 – 2018,“ European Photovoltaic Industry Association, pp. 39, http://www.epia.org/fileadmin/user_upload/Publications/EPIA_Global_Market_Outlook_for_Photovoltaics_2014-2018_-_Medium_Res.pdf.
[xxii] Philip Brown and Molly Sherlock, “ARRA Section 1603 Grants in Lieu of Tax Credits for Renewable Energy: Overview, Analysis, and Policy Options,” Congressional Research Service, February 8, 2011, http://assets.opencrs.com/rpts/R41635_20110208.pdf.
[xxiii] International Electrotechnical Commission, “Grid Integration of Large-Capacity Renewable Energy Sources and Use of Large-Capacity Electrical Energy Storage,” 2012, http://www.iec.ch/whitepaper/pdf/iecWP-gridintegrationlargecapacity-LR-en.pdf.
[xxiv] Nikhil Kumar, et al., “Power Plant Cycling Costs,” National Renewable Energy Laboratory, April 2012, http://wind.nrel.gov/public/wwis/aptechfinalv2.pdf.
[xxv] “Solar Energy Duck Curve,” Institute for Energy Research, October 27, 2014, https://www.instituteforenergyresearch.org/solar-energys-duck-curve/.
[xxvi] Kevin Eber and David Corbus, “Hawaii Solar Integration Study,” National Renewable Energy Laboratory, June 2013, http://www.nrel.gov/docs/fy13osti/57215.pdf.
