
Back in 2010, President Obama admitted that Congress and the American people had rejected a cap-and-trade program but that there were more ways of “skinning a cat” and his Administration would accomplish the same objective by another method. Now, the Obama Administration has proposed a model federal cap-and-trade plan as a component of the U.S. Environmental Protection Agency’s (EPA) regulation on carbon dioxide (CO2) emissions from power plants (the so-called “Clean Power Plan”). EPA’s carbon rule is the president’s attempt to pass national cap-and-trade through the back door.
EPA designed its carbon dioxide regulation to accommodate existing carbon-trading programs, such as the Regional Greenhouse Gas Initiative (RGGI). In 2009, ten northeastern states (now only nine) started complying with RGGI, a regional cap-and-trade scheme that proponents are pointing to as a successful model. While CO2 emissions have fallen in RGGI states, RGGI was not the driving factor. The CO2 allowance caps were set dramatically above actual CO2 emissions levels for the first years of the program. Once the impact of stricter emissions caps hits RGGI states, compliance costs will increase significantly and electricity prices for families and businesses will rise.
While EPA is touting RGGI and hoping to export cap-and-trade nationwide, supporters cannot argue that RGGI is an effective carbon-trading model. RGGI’s loopholes and structural problems conceal the true economic costs and circumvent actual emissions reductions. States should think twice before adopting similar schemes to comply with EPA’s carbon dioxide regulation. Far from a model for the nation, cap-and-trade is a costly scheme that states should view with caution.
Program Basics and Key Changes
Each RGGI state determines its CO2 allowance budget for every compliance year, and the regional cap—the total CO2 budget for all RGGI states—is comprised of the aggregate of these allowances. RGGI provides a mechanism to distribute allowances to “CO2 budget sources” through quarterly, regional auctions.[1]
The 2012 Program Review updated RGGI’s model rule and made critical changes to the initiative’s structure that attempted to chart a different course. Specifically, the review lowered the regional cap from 165 million short tons in 2013 to 91 million short tons in 2014 (a 45 percent decline).[2] As explained below, lowering the cap threatens to raise electricity prices significantly in future years.
Inherent Problems with RGGI
Due to flaws within RGGI, the program has not accomplished its intended aim of driving down carbon dioxide emissions. Most importantly, the regional cap was grossly over-allocated before 2014, making it effectively non-binding.
In 2005, when seven states signed the original memorandum, regulated carbon dioxide emissions were about 184 million short tons based on RGGI data. While it makes sense that RGGI states established an initial cap near that level (188 million short tons), CO2 emissions had fallen significantly to 122 million short tons by the time compliance began in 2009,[3] particularly due to increased electricity generation from natural gas and the economic downturn. As a result, this “first cap never compelled regulated entities to make internal emission reductions or purchase emission credits (or offsets).”[4] The chart below illustrates the substantial gap between CO2 emissions and the regional cap, which led to the dramatic over-allocation of CO2 allowances.
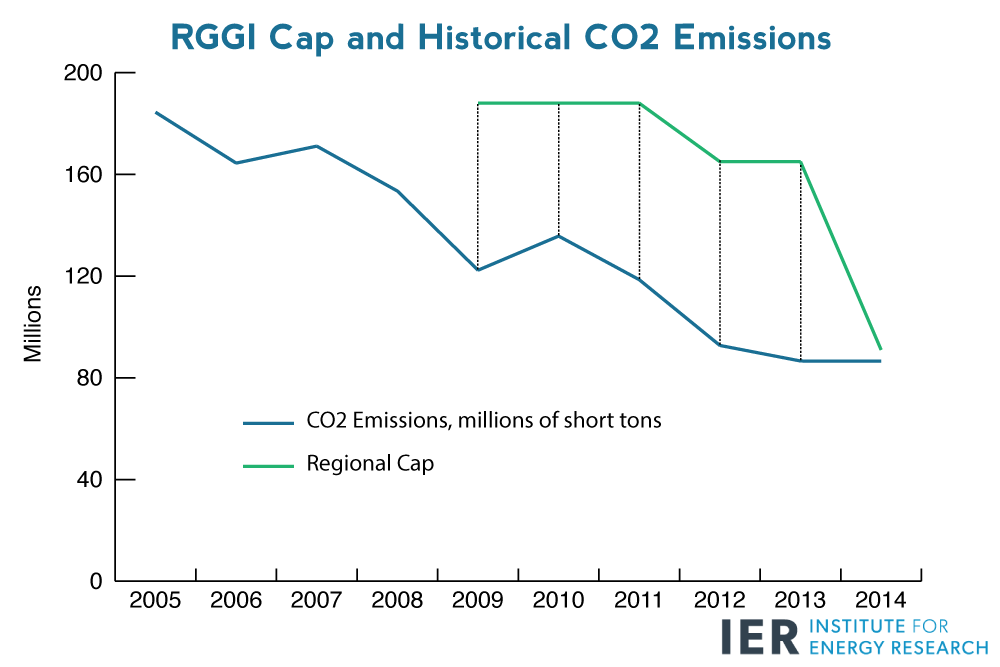
Source: Regional Greenhouse Gas Initiative historical data and Summary Level Emissions Reports
As others have pointed out, the high caps created a large surplus of CO2 allowances, which states could bank for future use. Based on this information, there is little evidence to suggest that RGGI has been even marginally effective at reducing carbon dioxide emissions. Even some who favor carbon pricing admit that RGGI’s updated model rule “falls short of creating real price pressures due to its closeness to baseline emissions.”
Carbon dioxide emissions began falling in RGGI states before the initiative went into effect. In fact, an analysis by the New York State Energy Research and Development Authority concluded that “fuel-switching from petroleum and coal to natural gas (due to relatively low natural gas prices)” was a primary driver of declining CO2 emissions in RGGI states from 2005 to 2009.[5] In turn, a key factor behind lower natural gas prices was booming domestic production on state and private lands.
Ultimately, declining CO2 emissions is a trend that started before the first compliance period and is not a result of carbon trading initiatives like RGGI.
Economic Pain Still to Come
Due to the over-allocation of CO2 allowances, RGGI states have been somewhat shielded from the negative economic impacts of carbon trading. However, once states face the new, stricter caps, the economic ramifications will be painful.
Furthermore, since economic conditions and other environmental regulations have encouraged fuel-switching to natural gas, a large portion of the low-hanging fruit has already been picked. Additional moves in this direction will become increasingly difficult.
There is some indication that these effects may be catching up to states. Clearing prices at auctions have risen dramatically over the last two years as emissions have neared the level of the reduced cap.
The trend of rising prices is only accelerating. In September 2015, prices breached $6 per ton, and in December 2015, clearing prices rose to $7.50—more than $2 above prices last December.[6] The graph below depicts how average clearing prices have risen after the regional cap tightened substantially in 2014. It compares RGGI emissions as a percentage of the cap with the quantity weighted average of auction clearing prices through the third quarter of 2015.[7]
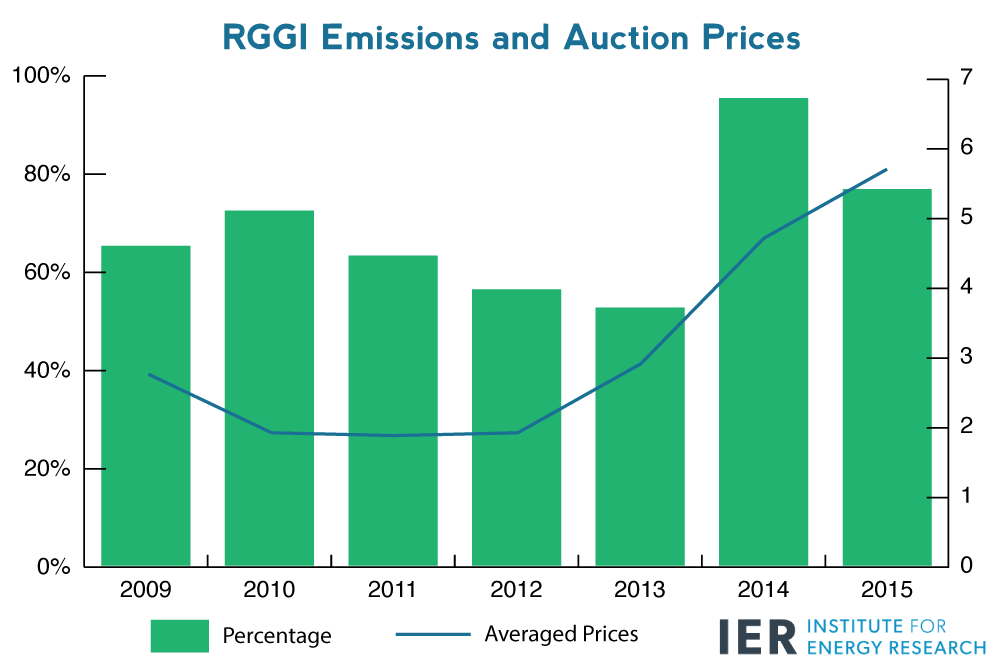
Source: IER calculations of RGGI data; 2015 data is for Q1–Q3
As clearing prices for CO2 allowances become increasingly expensive and states encounter diminishing returns from cutting carbon dioxide emissions, RGGI members will have more difficulty meeting the regional cap. In fact, for the first three quarters of 2015, RGGI states have emitted about 68 million short tons of CO2 and are quickly approaching the 2015 regional cap of 88.7 million short tons.
Since carbon-trading schemes artificially make certain technologies less economical or even uncompetitive, they create conditions that cause existing power plants to prematurely retire and saddle families and businesses with higher energy bills. An IER study found that existing sources generate electricity more affordably than new sources of the same type. Moreover, electricity from existing coal is nearly 3 times more affordable than electricity from new wind turbines and almost half as expensive as electricity from new natural gas plants. This is particularly problematic for RGGI states because their average retail electricity prices are already above the U.S. average.
Implications for Future Cap-and-Trade Programs
When considering carbon trading as a model for compliance with EPA’s carbon rule, states should be aware of the potential pitfalls. Looking to RGGI as a model for implementation is problematic because of its inherent structural issues and the negative economic consequences of carbon trading.
Two results are probable for future cap-and-trade programs. First, there is a high likelihood—at least initially—that political considerations and actions to minimize near-term pain (e.g., an over-allocated cap) will obscure the true effects of carbon trading. Certain provisions included in the 2012 Program Review illustrate this dynamic. Even though the regional cap was lowered, a cost containment reserve was established that permits the sale of additional allowances if auction prices become high enough. This effectively raises the cap when certain price levels are reached.[8] Similarly, the actual impacts of future cap-and-trade programs, such as EPA’s carbon regulation, may also be hidden.
Second, carbon-trading schemes that are used to comply with EPA regulations may need to be very strict, especially in the long-term. Since using a cap-and-trade scheme to implement EPA’s carbon rule would be binding for a state, the agency could enforce compliance and ensure that any flexibility provisions that states try to build into the program (e.g., offsets, over-allocated caps, etc.) do not interfere with emissions goals. In other words, the full economic costs of compliance would be borne by states, and opting-out would no longer be an option.
Conclusion
EPA is pressuring states to adopt a cap-and-trade scheme as a means of compliance with the carbon rule. While some point to RGGI as a success story and model for implementing carbon trading, this is a misreading of the data. Carbon dioxide emissions fell in RGGI states prior to compliance with the program. RGGI’s emissions goals were achieved because of a sluggish economy and fuel-switching, not carbon trading. Initially, the regional cap was approximately 50 percent higher than actual CO2 emissions and failed to pressure states to reduce emissions.
Any command-and-control program to reduce CO2 emissions will be economically painful. Once the impact of stricter emissions caps hits RGGI states, the economic costs of cap-and-trade will become evident, saddling families and businesses with higher energy costs. Although political considerations may cause states to circumvent repercussions in the short-term, the long-term effects will be severe, particularly for the poor and middle class. States should be wary of EPA’s proposal to design any state plan around regional carbon trading. In fact, the best way for states to protect their residents is to avoid making any binding commitments to implement EPA’s regulation before the legal challenges are resolved.
[1] Regulated entities include fossil fuel-fired power plants that have a capacity of at least 25 megawatts. At the end of every control period, each CO2 budget source must have obtained allowances equal to its carbon dioxide emissions. After acquiring CO2 allowances during quarterly auctions or through secondary markets, CO2 budget sources may bank surplus allowances for use in a future compliance period. Also see, http://www.rggi.org/docs/Compliance/2015/RGGI_Interim_Compliance_2015_Checklist.pdf.
[2] RGGI created an “adjusted cap” for each year between 2014 and 2020 to account for surplus CO2 allowances that were banked during the first or second control periods. See, RGGI, The RGGI CO2 Cap, http://www.rggi.org/design/overview/cap.
[3] IER calculations of RGGI data. See, RGGI, Summary Level Emissions Reports, accessed October 20, 2015, https://rggi-coats.org/eats/rggi/index.cfm?fuseaction=search.rggi_summary_report_input&clearfuseattribs=true.
[4] Jonathan L. Ramseur, The Regional Greenhouse Gas Initiative: Lessons Learned and Issues for Congress, CRS Report R41836, July 2, 2015, p. 4, https://www.fas.org/sgp/crs/misc/R41836.pdf.
[5] New York State Energy Research and Development Authority, Relative Effects of Various Factors on RGGI Electricity Sector CO2 Emissions: 2009 Compared to 2005, November 2, 2010, p. 3, http://www.rggi.org/docs/Retrospective_Analysis_Draft_White_Paper.pdf. The other key factors were lower electricity load (from weather, energy efficiency measures, and the economic recession) and capacity mix changes (more nuclear and renewable energy combined with less coal).
[6] See, RGGI, Allowance Prices and Volumes (by Auction), Auction Results, accessed December 7, 2015, http://www.rggi.org/market/co2_auctions/results.
[7] Note: The annual averages for auction clearing prices were found by calculating the quantity weighted average of the clearing prices for all four auctions held in each respective year (e.g., for 2014, the auction prices of $4.00, $5.02, $4.88, and $5.21 were weighted by the quantity of allowances sold and averaged). Emissions data for the year 2015 is not yet finalized, so this report only considers emissions through the first three quarters of 2015. For the sake of consistency, this report only looks at clearing prices for “current” offerings, even though RGGI offered “future” CO2 allowances for purchase during auctions in 2009, 2010, and 2011. See, http://www.rggi.org/market/co2_auctions/results for data.
[8] Ramseur, The Regional Greenhouse Gas Initiative, p. 15; also see, RGGI, Updated Model Rule, revised December 23, 2013, p. 7, http://www.rggi.org/docs/ProgramReview/_FinalProgramReviewMaterials/Model_Rule_FINAL.pdf.
