
On March, 13, 2013, the Institute for Energy Research (IER) participated in a hearing before the energy panel of the House Committee on Space, Science, and Technology. IER Distinguished Senior Fellow Mary Hutzler testified alongside other experts to discuss federal financial support for energy technologies. One of the witnesses for the panel, Dr. Terry Dinan, provided analysis from the Congressional Budget Office that warrants a lengthier response and rebuttal than the committee’s time allotment provided. The following represents the Institute for Energy Research (IER)’s reaction to the testimony prepared by the Congressional Budget Office (CBO).[i] The statements and page numbers refer to the CBO testimony; the comments are IER’s reaction to CBO’s statement.
Statement on page 1: Tax preferences for fuels and energy technologies were first established in 1916. For most years until 2005, the largest share of the support they provided went to domestic producers of oil and natural gas.
Comment: According to the Energy Information Administration (EIA), in fiscal year 1999, 58 percent of tax expenditures went to oil and natural gas and 31 percent went to renewable energy. However, if you consider all subsidies directed to these industries, including federal government direct expenditures, tax expenditures, and research and development funds, 28 percent were directed to oil and gas while 22 percent were directed to renewable energy and conservation.[ii] Further, in 1999, oil and gas produced 49 percent of our domestic energy, while renewables produced only 9 percent, with hydroelectric power producing half of the renewable amount, but getting a very small share of the renewable subsidy. (1999 was the only year that the EIA website had subsidy information prior to 2005.)
Statement on page 1: Most of the support for energy efficiency and renewable energy comes from provisions that have already expired or are scheduled to expire at the end of 2013. In contrast, most of the support for fossil fuels and nuclear power comes from provisions that are permanent.
Comment: The Production Tax Credit for wind was first instituted in 1992 by the Energy Policy Act of that year and has been extended 8 times. Its current extension is through the end of this year and was legislated by the American Taxpayer Relief Act of 2012. However, while expiring at the end of 2013, any wind farm that begins construction in 2013 will have 10 years of tax credits coming once it begins operation. The original law and the previous extensions mandated that the wind farm begin operation before the tax credit was to sunset. The Investment Tax Credit for solar energy originated with the Energy Tax Act of 1978 and was made permanent by the Energy Policy Act of 1992.
The tax deductions that the oil and gas industry receive mainly affect the independent oil and gas producers that explore and drill for oil in marginal wells. These tax deductions are akin to those that businesses receive for depreciation (percentage depletion allowance) and research and development (expensing of intangible drilling costs). All businesses receive the domestic manufacturing tax deduction, but the oil and gas industry can only claim a 6 percent deduction of its profits, while all other manufacturers can deduct 9 percent. Removal of the later tax deduction will force oil and gas companies to move overseas for their investments in exploratory drilling, increasing imports of energy while shifting jobs abroad.
Statement on page 1: Without government intervention, households and businesses do not have a financial incentive to take into account the environmental damage or their costs to the nation associated with their choices about energy production and consumption. The most direct and cost-effective method for addressing that problem would be to levy a tax on energy sources that reflects the environmental costs associated with their production and use.
Comment: European countries signed the Kyoto treaty and instituted a cap and trade program that is doing little to stop the use of fossil fuels. In fact, Europe is building coal fired power plants to back-up their intermittent renewable technologies, wind and solar power, because natural gas is more expensive than coal in many European countries and solar and wind power cannot be relied upon to generate electricity when needed since they only produce power when the sun shines and the wind blows. So, even with a cap and trade program, Europe burned more coal in 2011 (the most recent year of available data) than any time since it pledged cuts to greenhouse gas emissions.
China, India, Russia, and Germany, to name a few, are building coal-fired power plants. Worldwide coal plant construction grew 5.4 percent over the past year and now represents about 30 percent of installed capacity. According to the World Resources Institute, almost 1,200 coal-fired power plants are in the planning stages (a capacity of 1.4 million megawatts) and over three-quarters of them are to be built in China and India, where over 500,000 megawatts each are currently planned for construction.
Since greenhouse gas emissions are a global issue, the United States acting unilaterally would do little to reduce global greenhouse emissions and only make U.S. residents fuel poor by driving up energy prices. China, for example, consumes 4 times the amount of coal that we consume and emits the largest amount of greenhouse gases in the world.
Furthermore, CBO offers no clue as to what the “environmental damage or costs” associated with energy production and consumption might be. They just state that they exist. They also do not attempt to assess the benefits of the production and consumption of energy, for which there is a clear linkage. Nations of the world that consume large amounts of energy are wealthy, while those that do not are not. Assessing a tax to offset the costs of something else necessitates the use of a metric about what those costs might be, which the CBO does not characterize. CBO’s rhetorical device ignores the facts surrounding the production and consumption of energy in the United States, which has the most stringent environmental laws in the world. For example, the energy producer must absorb the costs associated with the temporary disruption of the surface area of land for which it pays rents, royalties, bonus bids and other payments to individuals or governments, returning it to its former condition or better. Are those costs already assumed in the payments? Would the CBO count the revenues and taxes generated directly and indirectly by increased economic activity consequent to production of energy against the perceived “costs” of environmental damages? Would the CBO also include in its calculus the “benefits” of additional supplies of energy beyond the tax and other revenues to governments, such as the creation of an economic base for communities, lower energy prices and their impact on economic growth, jobs for workers who seek them and revenues to private landowners?
Congress should insist that CBO, which works for the Legislative Branch, begin to work on assessing the benefits as well as the costs of energy production and consumption, because it is apparent from CBO’s testimony that this was not undertaken. The omission of such an analysis appears to run counter to CBO’s mission established in the Budget Impoundment and Control Act of 1974.
Statement on page 1: Also, unless the government intervenes, the amount of research and development that the private sector undertakes is likely to be inefficiently low from society’s perspective because firms cannot easily capture the “spill-over benefits” that result from it, particularly in the early stages of developing a technology.
Comment: It is the private sector and the market that has determined and built most of the technologies that have been successful in the United States, and that record is the envy of the world. For example, the most important technological advancements and biggest change in energy production in the last couple decades — hydraulic fracturing coupled with directional drilling– was initiated by the private sector. Hydraulic fracturing was first used in the 1920s by the private sector. It was not until the 1970s that the Department of Energy spent a small amount of R&D funds on the technology. The hydraulic fracturing revolution shows why the market is superior to government subsidies in selecting winning technologies. It has dramatically lowered natural gas prices, increased oil production on non-federal lands at the fastest rate since 1859, created jobs, and led to real benefits for Americans, which is not the case for most government subsidies. According to Dan Yergin, production of unconventional oil and gas has generated 1.7 million jobs and could generate 3 million jobs by 2020. In 2012, this revolution added $62 billion to federal and state government revenues that could rise to about $113 billion by 2020, according to Yergin.[iii]
Statement on page 2: From 1916 to the 1970s, federal energy-related tax policy focused almost exclusively on increasing the production of domestic oil and natural gas; there were no tax incentives for promoting renewable energy or increasing energy efficiency. In the 1970s, lawmakers began adding tax preferences for new sources of fossil fuel, alternatives to fossil fuel, and energy efficiency.
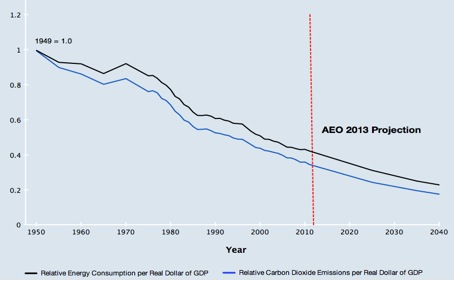
Comment: The authors fail to recognize that in 1978, lawmakers provided a 10 percent investment tax credit to solar energy through the Energy Tax Act of that year, as explained above. Moreover, efficiency did not begin with tax policies in the 1970’s, but rather, as a normal human goal. As this chart demonstrates, energy use per dollar of GDP was already well established on a downward trend well before the tax policies mentioned by CBO. Ben Franklin invented the Franklin Stove in 1741 as a more efficient means of heating homes. And, any time someone determines that it is in their interest to save money by reducing their energy consumption, they tend to do it.
Energy Consumption and Carbon Dioxide Emissions per Dollar of GDP
Statement on page 6: Most of the support for energy efficiency and renewable energy in 2013 comes from provisions that are temporary. In contrast most of the support for fossil fuels and nuclear energy comes from provisions that are permanent.
Comment: The authors fail to mention that there is a permanent 10 percent investment tax credit for solar energy, made permanent by the Energy Policy Act of 1992, as explained above.
Statement on page 7: In 2009, DOE received $39 billion (in current dollars) for support of energy technologies (after accounting for rescissions and transfers)—roughly 17 times the average annual appropriation for the preceding decade. …. Although ARRA funds have generally been spent more rapidly than funds that DOE has received through the normal appropriation process, roughly $5 billion of ARRA funding for the fuels and energy technology programs remain unspent.
Comment: The stimulus funding in 2009 from the American Recovery and Reinvestment Act (ARRA) totaled $787 billion[iv], and most of those funds have been paid out according to the government’s website[v]. Over $90 billion was earmarked for ‘green programs.’ However, the total that went to green energy projects is not clear. Brookings estimated it at $51 billion, with a total government spending (both stimulus and non-stimulus) on green initiatives at $150 billion through 2014.[vi]
Unfortunately, about 50 firms receiving government funds are either bankrupt (23) or are having difficulties (27), and many of the latter are in financial trouble.[vii] Over $15 billion of taxpayer money is either gone or at risk. Further, 29 of the 50 companies had or have political connections, putting the percentage of political cronyism at almost 60 percent.
Many of the loans/loan guarantees were pushed quickly through the system by DOE because of political pressure to the detriment of the American taxpayers, the most famous of which is Solyndra, a solar manufacturer that received almost all of the $535 million loan awarded it before filing for bankruptcy in 2011. The cause of Solyndra’s demise was its complicated technology that required a custom manufacturing facility and an expensive price tag.
Abound Solar, another solar manufacturer that received a DOE loan guarantee for $400 million, filed for bankruptcy in June 2011 after it had laid off 70 percent of its workforce that February.[viii] According to the Daily Caller, Abound Solar sold defective or underperforming products, and company personnel claimed DOE officials knew their panels were faulty before they received taxpayer dollars.[ix] Virtually all of the panels Abound manufactured underperformed, putting out between 80 and 85 percent of the promised wattage and leading to tens of thousands of panels having to be replaced, particularly towards the end of the company’s life.
First Solar, one of the biggest recipients from DOE’s loan guarantee program, garnered over $3 billion[x] before the program expired at the end of September 2011.[xi] At the time, DOE was under pressure not to repeat its prior mistakes, but again the agency provided a loan guarantee to a losing company. For example, early in 2012, First Solar laid off half of its employees at its Antelope Valley Solar Ranch One project in the Southern California desert, which was the recipient of a $646 million loan guarantee that was to create 350 construction and 20 permanent jobs. Further exploiting taxpayers dollars, in 2011, First Solar paid its top eight executives almost $16 million. Rob Gillette, who was terminated as CEO of First Solar in October 2011, received more than $32 million since his employment began in October 2009. First Solar sold much of its $3 billion in federal loan guarantees to third parties before it laid off 30 percent of its workforce. Its stock price plummeted by more than 90 percent from its high in 2011, but not before its head officer received more than$329 million in stock sales since 2009.
Solar technology firms were not the only companies that received DOE awards, but failed to materialize any benefits. Fisker Automotive, a Finnish electric car maker, originally received $529 million in DOE loan guarantees, but was cut off at $193 million because it failed to reach milestones for its luxury vehicle Karma. The company suffered recalls of its extended-range electric sedan that cost over $100,000, because of technology flaws and failed batteries, which resulted in fires. The federal subsidies attracted some of the rich and famous, as it has been a favorite status purchase for Hollywood movie stars and celebrities, rappers and Hip Hop musicians, and soap opera stars. Consumer Reports gave the Karma a terrible review, calling it the worst luxury sedan on the market.
Fisker’s battery supplier, A123 Systems, supplied the defective batteries. A123 Systems declared bankruptcy in October 2012, but not before receiving $132 million from its $279 million DOE loan guarantee to refurbish two Michigan plants plus other projects.[xii] Here again the loan guarantee was moved quickly by DOE. Similar to First Solar, A123’s officers and directors made more than $11 million in stock sales before the bankruptcy filing.
The Heritage Foundation put together a list of 34 companies that received federal support from taxpayers that have faltered or are now faltering.[xiii] These companies have either gone bankrupt, laid off workers, or are heading for bankruptcy. The list below provides the 34 companies along with the amount of money they were offered by the U.S. Department of Energy and other federal government agencies. The amount of money listed does not include other state, local, and federal tax credits and subsidies. The at-risk total is approximately $7.5 billion, of which $1.6 billion is in receivership. And the total will likely get larger as more is known about each company.
- Evergreen Solar ($25 million)*
- SpectraWatt ($500,000)*
- Solyndra ($535 million)*
- Beacon Power ($43 million)*
- Nevada Geothermal ($98.5 million)
- SunPower ($1.2 billion)
- First Solar ($1.46 billion)
- Babcock and Brown ($178 million)
- EnerDel’s subsidiary Ener1 ($118.5 million)*
- Amonix ($5.9 million)
- Fisker Automotive ($529 million)
- Abound Solar ($400 million)*
- A123 Systems ($279 million)*
- Willard and Kelsey Solar Group ($700,981)*
- Johnson Controls ($299 million)
- Schneider Electric ($86 million)
- Brightsource ($1.6 billion)
- ECOtality ($126.2 million)
- Raser Technologies ($33 million)*
- Energy Conversion Devices ($13.3 million)*
- Mountain Plaza, Inc. ($2 million)*
- Olsen’s Crop Service and Olsen’s Mills Acquisition Company ($10 million)*
- Range Fuels ($80 million)*
- Thompson River Power ($6.5 million)*
- Stirling Energy Systems ($7 million)*
- Azure Dynamics ($5.4 million)*
- GreenVolts ($500,000)
- Vestas ($50 million)
- LG Chem’s subsidiary Compact Power ($151 million)
- Nordic Windpower ($16 million)*
- Navistar ($39 million)
- Satcon ($3 million)*
- Konarka Technologies Inc. ($20 million)*
- Mascoma Corp. ($100 million)
*Denotes companies that have filed for bankruptcy.
Statement on page 11: Because many sectors of the U.S. economy—especially transportation—use oil, the United States is economically vulnerable to a disruption in the supply of oil. Reducing exposure to that disruption would require a large decrease in the total amount of oil consumed in the United States.
Comment: There are other ways to ensure security of supply in oil. Forecasts have shown that the United States can become independent of overseas oil by using its own vast domestic oil resources and that of its neighbors that are trusted allies. North America has 1.79 trillion barrels of technically recoverable oil, enough to last over 250 years at current usage rates in the United States.[xiv] Of that amount, over 210 billion barrels are proven reserves, equal to over 80 percent of Saudi Arabia’s proven reserves. What we need is to be able to move Canada’s vast proven reserves to the United States by the cleanest and most economical way—one example being the Keystone pipeline that is awaiting a Presidential permit since it would cross the U.S. Canadian border. The delay in its approval from the Obama administration has been 4 long years and has cost the American public more because Canadian oil is being moved by more expensive rail.
Further, the Obama Administration could allow oil and gas companies access to the 1.442 trillion barrels of technically recoverable oil in the United States. Production of shale oil in the United States, for example, has increased oil production on non-federal lands at the fastest rate since 1859, created jobs, and led to real benefits for Americans improving state economies where that production is taking place. The United States has almost 1 trillion barrels of technically recoverable oil shale that lie on mostly federal lands that the Obama Administration has restricted from leasing and thereby not allowing the technology to develop it to be developed. Areas that the federal government could open to oil gas development include:
- The 10.4 billion barrels of oil in the Arctic National Wildlife Refuge
- The 86 billion barrels of oil in the outer continental shelf of the lower 48 states
- The 896 million barrels of oil in the Naval Petroleum Reserve-Alaska
- The 25 billion barrels of oil in the outer continental shelf of Alaska
- The 90 billion barrels of oil in the geologic provinces north of the Arctic circle
- The 982 billion barrels of oil shale in the Green River Formation in Colorado, Utah, and Wyoming.
Statement on page 11: The most cost effective way to reduce the external costs associated with energy would be to enact policies, such as taxes, that would increase the prices of various types of energy to reflect the external costs that their production and use entail. That approach would provide a financial incentive for businesses and households to consider those external costs when deciding on the types and amounts of energy to use.
Comment: As mentioned above, European countries that signed the Kyoto treaty instituted a cap and trade program that is doing little to stop the use of fossil fuels. In fact, Europe is building coal fired power plants to back-up their intermittent renewable technologies. So, even with a cap and trade program that taxes fossil fuels, primarily coal, Europe burned more coal in 2011 (the most recent year of available data) than any time since it pledged cuts to greenhouse gas emissions.
Australia implemented a carbon tax and the country has found that businesses are going under as a result. Business insolvencies are at a record high in Australia and show that the carbon tax is doing damage since their products can no longer compete against imports. The Australian Securities and Investments Commission recorded more than 10,500 company collapses for the first 2 months of this year. It is estimated that about 900 firms are being placed in administration every month – more than during the global financial crisis.[xv]
Since greenhouse gas emissions are a global issue, the United States acting unilaterally would do little to reduce global greenhouse emissions and only make U.S. residents fuel poor by driving up energy prices. China, for example, consumes 4 times the amount of coal that we consume and emits the largest amount of greenhouse gases in the world. While they make investments in clean energy, about 30 percent of their wind units are unusable since they are not integrated with the country’s electricity grid. Further, China continues to build coal-fired power plants at breakneck speeds to provide power to residents without electricity, producing more than 70 percent of its electricity from coal.
Also, as mentioned previously, CBO offers no definition of what those external costs are, but emphatically states they exist. All economic activities have external costs, as they represent opportunity costs of doing something differently. CBO’s assumption that everyone agrees with its assessment that external costs have not been internalized by consumers appears to be a “we know best what is right for people,” which accordingly obliges CBO to provide the analysis to back up its claim. Such analysis, as stated previously, should of necessity also chronicle the external benefits which accrue to society and our nation in order to be comprehensive and in keeping with its mission under the law.
[i] Congressional Budget Office, Federal Financial Support for Fuels and Energy Technologies, March 13, 2013, http://science.house.gov/sites/republicans.science.house.gov/files/documents/HHRG-113-SY20-WState-TDinan-20130313.pdf
[ii] Energy Information Administration, Federal Financial Interventions an Subsidies in Energy Markets 2007, http://www.eia.gov/oiaf/servicerpt/subsidy2/pdf/execsum.pdf
[iii] Testimony of Daniel Yergin, Hearing on America’s Energy security and Innovation, Subcommittee on Energy and Power, House Committee on Energy and Commerce, February 5, 2013, http://docs.house.gov/meetings/IF/IF03/20130205/100220/HHRG-113-IF03-Wstate-YerginD-20130205.pdf
[iv] CNN Money, What we got for $50 billion in ‘green’ stimulus, October 3, 2012,http://money.cnn.com/2012/10/03/news/economy/green-stimulus/index.html
[v] Recovery.gov, Track the Money, http://www.recovery.gov/Pages/default.aspx
[vi] Brookings, Beyond Boom & Bust, April 2012, http://www.brookings.edu/~/media/Research/Files/Papers/2012/4/18%20clean%20investments%20muro/0418_clean_investments_final%20paper_PDF.PDF
[vii] Green Corruption, Tracking Obama’s Green Energy Failures, October 20, 2012, http://greencorruption.blogspot.com/2012/10/green-alert-tracking-president-obamas.html#.UTYhr6KzeSr
[viii] National and Legal Policy Center, Surprise! Another DOE Solar ‘Bet’ Produces Green Job Losses, March 1, 2012, http://nlpc.org/stories/2012/03/01/surprise-another-doe-solar-bet-produces-green-job-losses
[ix] Dally Caller, Sources, documents suggest government-subsidized Abound Solar was selling faulty product, October 2, 2012, http://dailycaller.com/2012/10/02/sources-documents-suggest-government-subsidized-abound-solar-was-selling-faulty-product/?print=1
[x] National Legal and Policy Center, Taxpayers Reward Executives for Failure as Green Jobs are Slashed, April 19, 2012, http://nlpc.org/stories/2012/04/18/taxpayers-reward-executives-failure-green-jobs-are-slashed
[xi] 11th hour DOE deals: 4 solar loan guarantees, September 30, 2011, http://gigaom.com/cleantech/11th-hour-doe-deals-4-solar-loan-guarantees/
[xii][xii] New York Times, Maker of Batteries Files for Bankruptcy, October 16, 2012, http://www.nytimes.com/2012/10/17/business/battery-maker-a123-systems-files-for-bankruptcy.html?nl=todaysheadlines&emc=edit_th_20121017&_r=3&
[xiii] The Heritage Foundation, President Obama’s Taxpayer-Backed Green Energy Failures, October 18, 2012, http://blog.heritage.org/2012/10/18/president-obamas-taxpayer-backed-green-energy-failures/
[xiv] Institute for Energy Research, North American Energy Inventory, December 2011, https://www.instituteforenergyresearch.org/wp-content/uploads/2013/01/Energy-Inventory.pdf
[xv] Yahoo News, Carbon Tax, Business Closures Link, March 18, 2013, http://au.news.yahoo.com/latest/a/-/article/16387583/carbon-tax-business-closures-link-libs/
