
According to a new report from the Congressional Research Service (CRS), oil production on federal lands has not recovered from its high in fiscal year 2010, when President Obama forced a moratorium on offshore oil. In fiscal year 2015, oil production on federal lands was still 0.1 percent less than its high reached in fiscal year 2010. In contrast, oil production on private and state lands has been booming, and was 115 percent higher in fiscal year 2015 than in fiscal year 2010. Similarly, natural gas production on federal lands was 29 percent less in fiscal year 2015 than in fiscal year 2010. In contrast, natural gas production on private and state lands in fiscal year 2015 was up by 49 percent since fiscal year 2010. If more oil and gas production is a good thing for the United States, the Obama Administration’s policies are certainly a lesson in what not to do.
In fiscal year 2010, 36 percent of our nation’s oil production was produced on federal lands. Due mainly to Obama Administration policies, by fiscal year 2015, only 21 percent of our nation’s oil production was produced on federal lands. Production on non-Federal lands, in contrast, is skyrocketing, as hydraulic fracturing and horizontal drilling have increased production dramatically. Oil production on non-Federal lands increased by 13 percent in fiscal year 2015 from fiscal year 2014 levels—an increase of close to one million barrels per day, while oil production on federal lands increased by 11 percent—just 0.2 million barrels per day.[i]
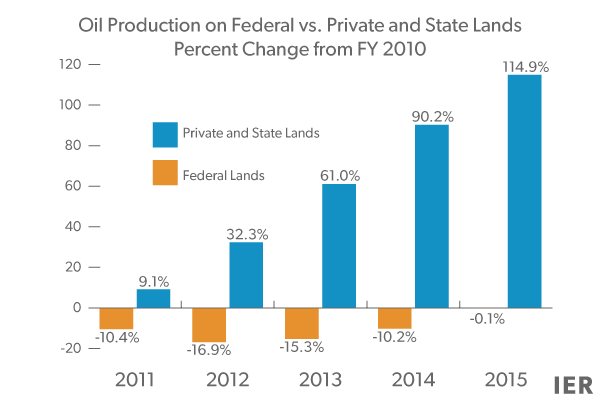
Source: CRS, https://www.instituteforenergyresearch.org/wp-content/uploads/2016/04/CRS_Fed-vs-NonFed_Feb2016.pdf
Natural gas production on federal lands has generally been declining since fiscal year 2007, with a slight uptick in fiscal year 2015. However, production remains far below its fiscal year 2007 high. Natural gas production on non-federal lands, in contrast, has been steadily increasing. In fiscal year 2015, natural gas production on non-federal lands increased by 9 percent—1,988 billion cubic feet— over fiscal year 2014 levels, and natural gas production on Federal lands increased by just 2 percent—by 70 billion cubic feet. As a result, the increase in natural gas production on private and state lands in fiscal year 2015 was 28 times larger than the increase on federal lands.
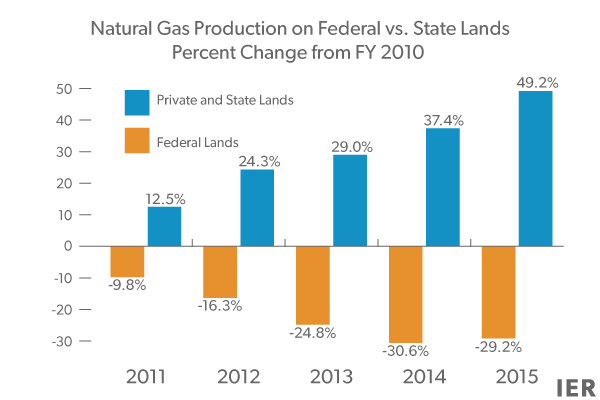
Source: CRS, https://www.instituteforenergyresearch.org/wp-content/uploads/2016/04/CRS_Fed-vs-NonFed_Feb2016.pdf
Historical Production Data
Looking at a time trend of historical production data provides an even more dramatic indication that the Obama Administration’s policies are hurting oil and gas production on Federal lands, while oil and gas production on non-Federal lands is skyrocketing. Between fiscal years 2010 and 2015, crude oil production on state and private lands increased by almost 4 million barrels per day, an amount which is more than each of the following oil producing nations — Algeria, Libya, Angola, Nigeria, Kuwait, Iran, Iraq, Venezuela, Columbia, Brazil, Mexico, Qatar, United Arab Emirates, or Norway– produced in 2014.
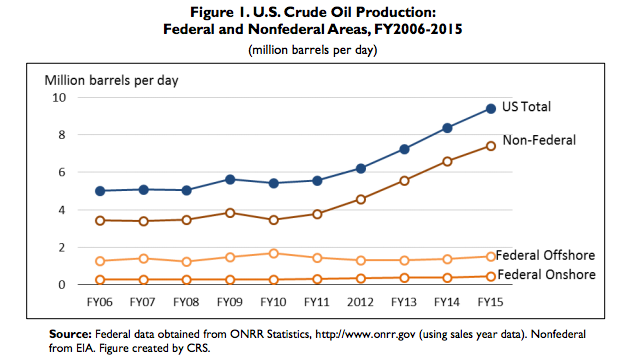
Source: https://www.instituteforenergyresearch.org/wp-content/uploads/2016/04/CRS_Fed-vs-NonFed_Feb2016.pdf
Likewise, natural gas production on federal lands, both onshore and offshore, has generally decreased, while natural gas production on non-federal lands has steadily increased.
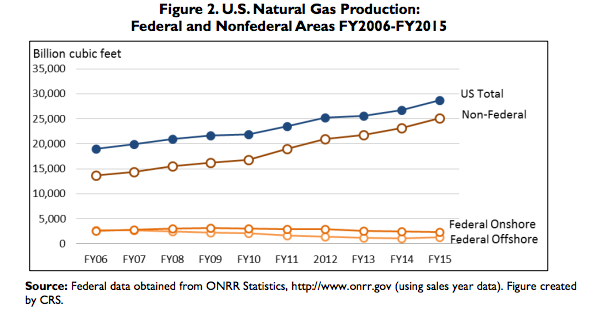
Source: https://www.instituteforenergyresearch.org/wp-content/uploads/2016/04/CRS_Fed-vs-NonFed_Feb2016.pdf
Obama Administration Policies
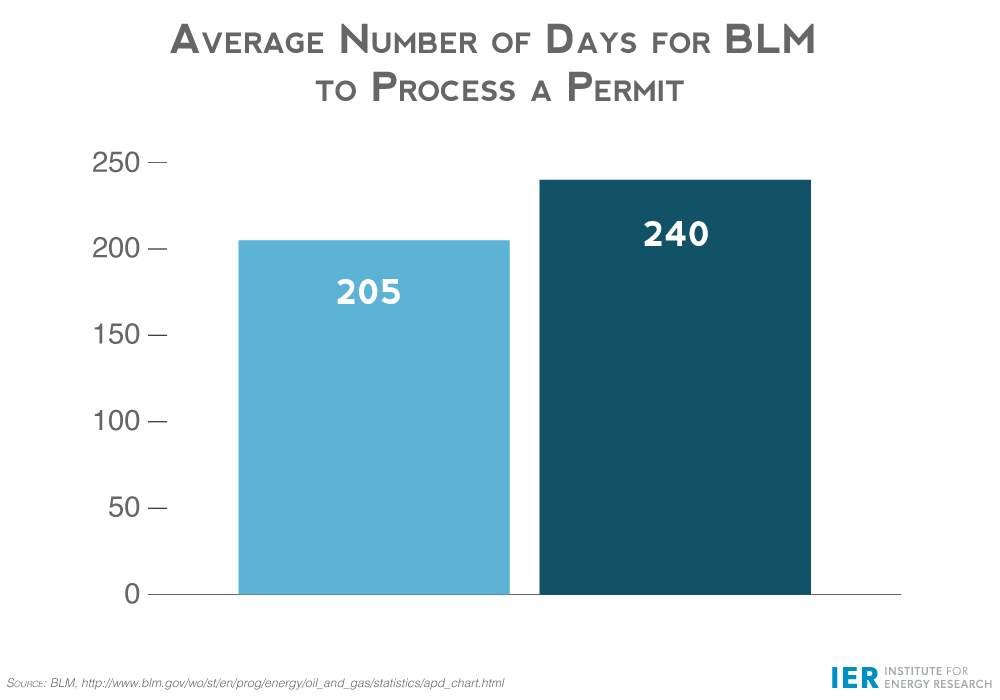
The Obama Administration has increased the time it takes to obtain a permit to drill on Federal lands, driving oil and gas companies to private and state lands on which to make their investments. After a company has obtained a lease, it must also obtain an application for permits to drill (APD) for each oil and gas well. Despite the Energy Policy Act of 2005 providing a new improved timeline for review, it took an average of 307 days to approve or deny an APD in fiscal year 2011, 89 days more than the 218 days it took in fiscal year 2006, which is 41 percent more time. In its budget justifications, the Bureau of Land Management indicated that overall processing times per APD have increased because of the complexity of the process, a process they themselves control.
Since fiscal year 2011, the Bureau of Land Management has improved the time it takes to process a permit. However, the average time during the Obama Administration is still 16 percent longer than the time it took to process a federal permit to drill during the 5 preceding fiscal years. (See chart below.)
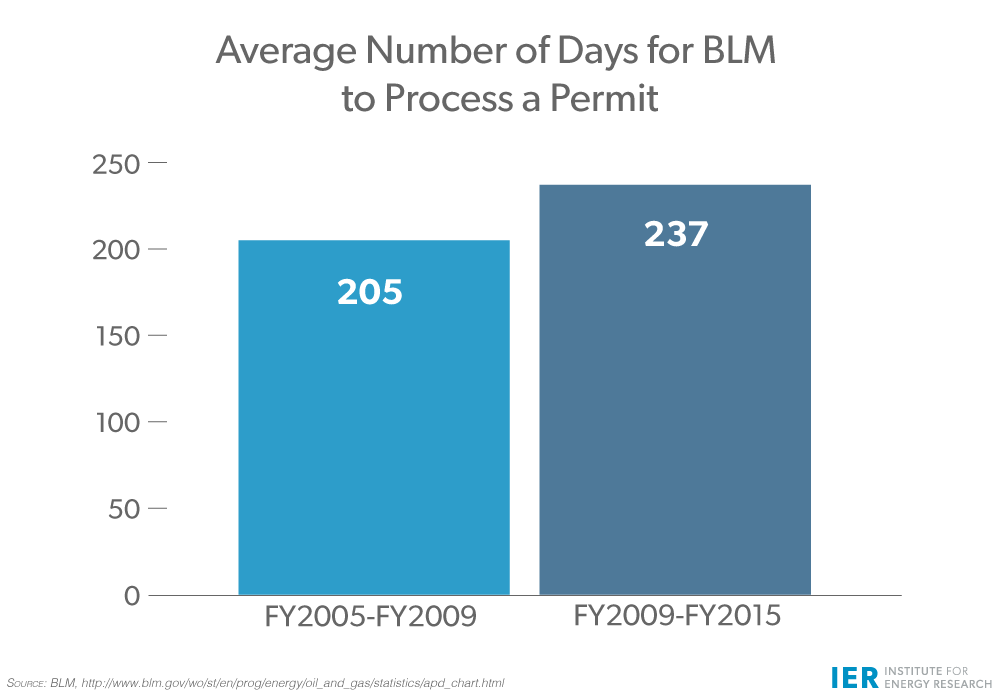
Source: BLM, http://www.blm.gov/wo/st/en/prog/energy/oil_and_gas/statistics/apd_chart.html
In contrast, the process on private and state lands is relatively quick. State agencies process drilling permits on private lands, with some states approving permits within 10 business days. (In Texas, standard permits take approximately 4 days, while expedited permits take 2 days). On private lands, states allow some surface management issues to be negotiated between the oil producer and the individual land/mineral owner. To see the success of hydraulic fracturing and shale oil development on non-Federal lands, one only needs to look at North Dakota, the second-largest oil producing state in the nation behind Texas. North Dakota has an unemployment rate of just 2.9 percent, compared to 5.0 percent for the nation. Most of the land in North Dakota is not controlled by the Federal government.
Besides taking an enormously long time to process permits, the number of leases on federal lands is down dramatically under the Obama Administration as the chart below shows. The average number of onshore leases that the Bureau of Land Management issued under the Obama Administration is almost 60 percent less than the average number issued by the Clinton Administration, and over 45 percent less than those issued by the Bush 43 Administration. In fiscal year 2015, only 852 leases were issued. To put that in perspective, 2,894 fewer leases were issued in fiscal year 2015 compared to fiscal year 2006, when 3,746 leases were issued. This is also a 26 percent decrease from the previous fiscal year. In fiscal year 2015, BLM issued the fewest number of leases since President Obama took office in 2009.
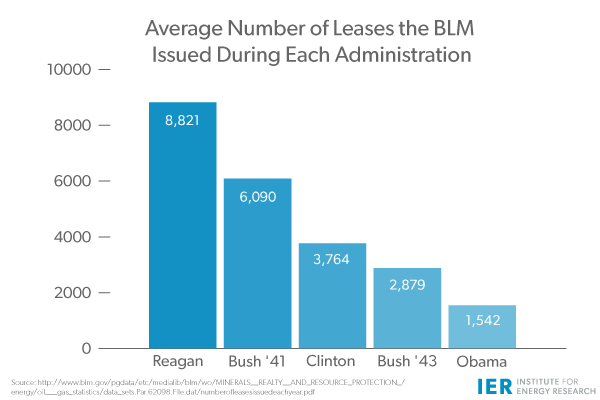
Source: BLM, Table 4, http://www.blm.gov/wo/st/en/prog/energy/oil_and_gas/statistics.html
There are numerous benefits to opening Federal lands to oil, gas, and coal development. An IER study shows that opening federal lands and waters to exploration and production would increase federal tax revenue by $24 billion annually in the short-run (over seven years) and $126 billion annually thereafter, while state and local governments would receive $10 billion in annual state and local tax revenue over the short-run and $61 billion annually thereafter. Over 37 years, federal and state and local tax revenues would increase to $3.9 trillion in federal revenues and $1.9 trillion in state and local revenues.
Further, the economy would benefit by $127 billion annually over the short-run (seven years), and $663 billion annually in the long run. Most impressively, the opening of federal lands could have a cumulative increase in economic activity of up to $20.7 trillion over a period of 37 years. The ripple effect of that boom would be the creation of 552,000 jobs annually over the short-run (seven years) with annual wage increases of up to $32 billion and an increase of 2.7 million jobs annually in the long run, with annual wage increases of $163 billion.[ii]
Conclusion
Oil and natural gas production on private and state lands is skyrocketing, while production on Federal lands is largely in decline and has been throughout most of the Obama Administration’s tenure. The Obama Administration is offering less land for leasing and taking longer to process permits to drill than prior administrations. As a result of the red tape, oil and natural gas producers are turning to private and state lands to make their investments and to produce affordable energy for American families.
[i] Congressional Research Service, U.S. Crude Oil and Natural Gas Production in Federal and Non-Federal Areas, February 26, 2016, https://www.instituteforenergyresearch.org/wp-content/uploads/2016/04/CRS_Fed-vs-NonFed_Feb2016.pdf
[ii] Institute for Energy Research, Economic Effects of Immediately Opening Federal Lands to Oil, Gas and Coal Leasing, December 2015, https://www.instituteforenergyresearch.org/wp-content/uploads/2016/01/IER-Mason-Study.pdf
