
For the past decade, natural gas production in the United States has grown by over 40 percent thanks to the use of hydraulic fracturing and horizontal drilling in shale formations. The United States now stands alone as the largest natural gas producer in the world, surpassing Russia in 2011. A decade ago, energy forecasters believed that the United States would be importing liquefied natural gas to meet U.S. natural gas demand—that domestic production and pipeline imports from Canada and Mexico would not be sufficient supply. Instead, the natural gas production boom has resulted in the United States exporting liquefied natural gas as early as the end of this year, making Europe less dependent on Russia for natural gas and helping to meet growing demand in Asia.
U.S. Natural Gas Imports and Exports
According to the Energy Information Administration (EIA), net natural gas imports fell to their lowest level since 1987, as the United States out-produced every country in the world in natural gas production. Net natural gas imports (imports minus exports) totaled 1,171 billion cubic feet in 2014—9 percent lower than last year and a continuation of an 8-year decline. The majority (98 percent) of U.S. natural gas imports come from Canada by pipeline. In 2014, net imports from Canada represented 7 percent of total U.S. natural gas consumption, lower than the 11 percent it represented in 2009. Net imports of liquefied natural gas was down by 54 percent in 2014, continuing a 5-year decline.[i]
Mexico received almost 50 percent of U.S. natural gas exports and these exports increased by 12 percent in 2014. Natural gas is exported to Mexico through pipelines crossing the international border in Texas, California, and Arizona. These exports increased to a record 706 billion cubic feet in 2014 to meet demand from new natural gas power plants in Mexico. The natural gas was produced from the U.S. Gulf Coast and the Eagle Ford Shale in southern Texas.
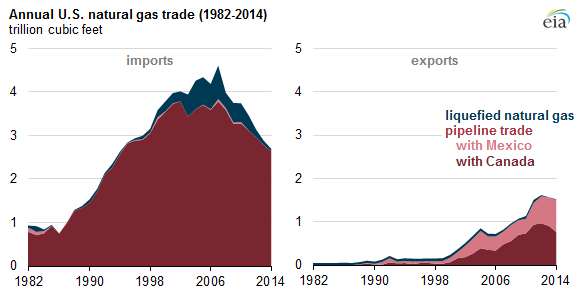
Source: EIA, http://www.eia.gov/todayinenergy/detail.cfm?id=21332
U.S. Natural Gas Production
The United States produced 25.7 trillion cubic feet of natural gas in 2014, 42 percent more than in 2005 and 5.7 percent more than in 2013. (See chart below.) Texas is the largest producer of natural gas in the United States and its production surpasses natural gas production in each of the countries of the Organization of Oil Producing Countries (OPEC). The only country whose natural gas production it does not surpass is Russia. Pennsylvania’s natural gas production from the Marcellus shale formation is second to that of Texas, and it is followed by gas production in Louisiana, and Oklahoma.
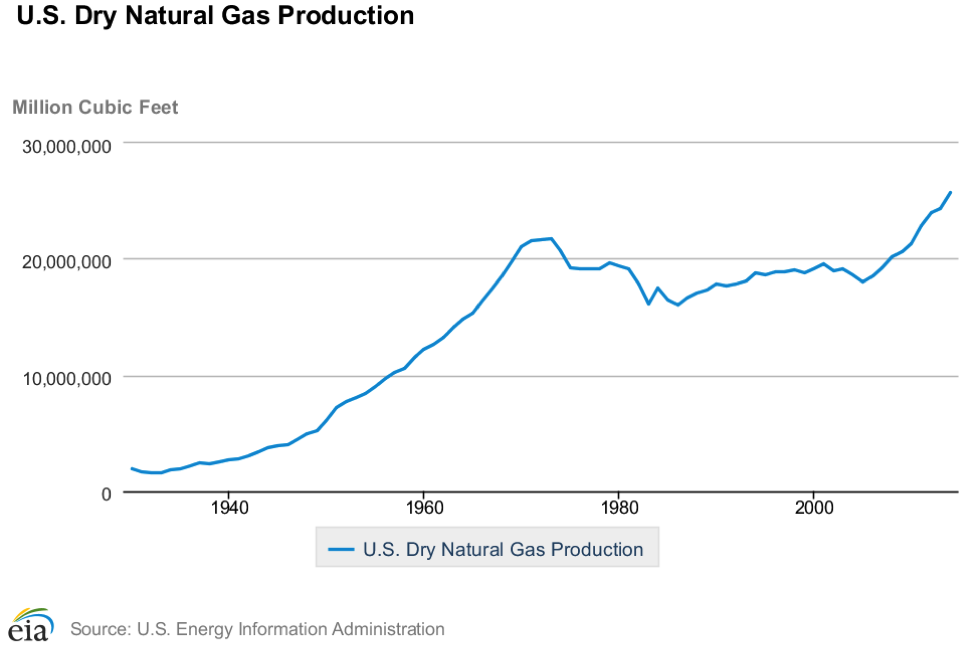
Source: EIA, http://www.eia.gov/dnav/ng/hist/n9070us2a.htm
Individual U.S. states now produce so much natural gas, they outrank whole countries when it comes to daily production. Iran, the largest OPEC gas producer, produced 5,696 billion cubic feet of natural gas in 2013, 17 percent less than the 6,855 billion cubic feet of natural gas produced in Texas. Qatar, OPEC’s number two gas producer, produced 5,598 billion cubic feet of natural gas in 2013, 18 percent less than the production in Texas. (See chart below.)
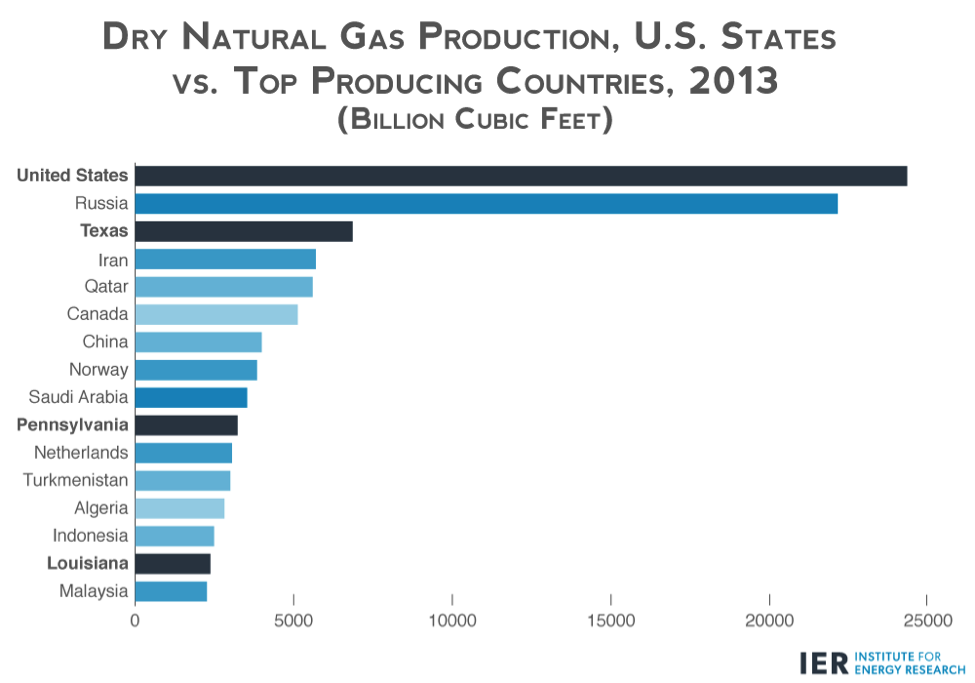 Source: EIA, http://www.eia.gov/cfapps/ipdbproject/IEDIndex3.cfm?tid=3&pid=26&aid=1 and http://www.eia.gov/dnav/ng/ng_prod_sum_dcu_spa_a.htm
Conclusion
U.S. ingenuity, investment, hard work, and reasonable regulations on private and state lands have made the United States the largest natural gas producer in the world. Hydraulic fracturing is now enabling the United States to produce enough gas domestically so that U.S. natural gas producers can export liquefied natural gas and help our allies in Europe be less dependent on Russian gas and help supply the growing gas demand in Asia. This not only strengthens our economy, but also strengthens our national security by strengthening our energy relationships with other countries around the world.
[i] Energy Information Administration, Net imports of natural gas fall to lowest level since 1987, May 21, 2015, http://www.eia.gov/todayinenergy/detail.cfm?id=21332
