
Every year BP releases a Statistical Review of World Energy.[i] This report is greeted by energy experts as one of the best snapshots of the world energy situation. This year, however, the release of the report was overshadowed by BP’s struggle to stop the flow of oil from the Macondo well and to deal with the aftermath of the tragic explosion on the Deepwater Horizon which killed 11 people.
Despite the timing, there is important information in this review. According to the report:
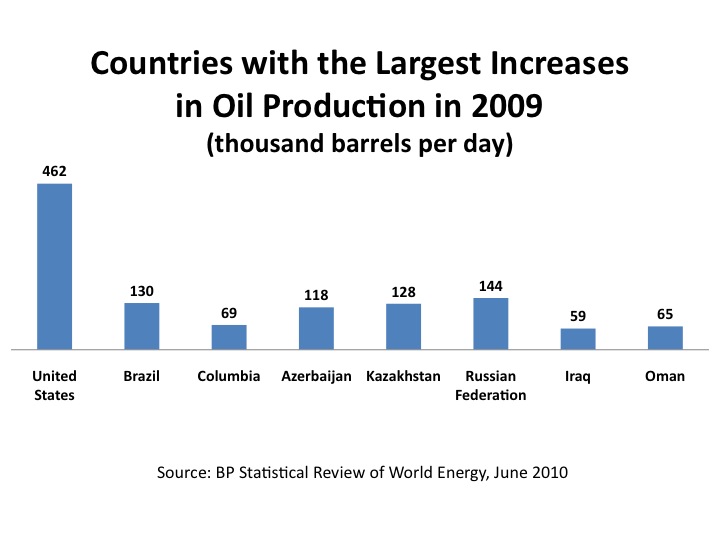
- The United States increased its oil and natural gas production more than any country.
- In 2009, Russia surpassed Saudi Arabia as the world’s largest oil producer.
- Global proved oil reserves are at the highest levels of all time. At the end of 2009, there were 1,333.1 billion barrels of proven reserves. Including Canadian oil sands brings total oil reserves to 1,476 billion barrels.[ii]
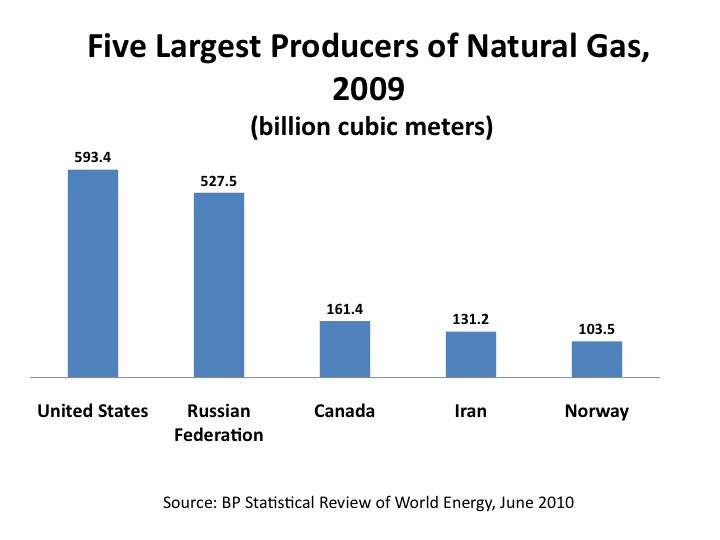
- The United States surpassed Russia as the world’s largest producer of natural gas.
- Global proved natural gas reserves are at the highest levels of all time. Global reserves of natural gas at the end of 2009 were 6,621 trillion cubic feet[iii], an increase of 1.2 percent. These reserves would last about 63 years at 2009 world production levels.[iv]
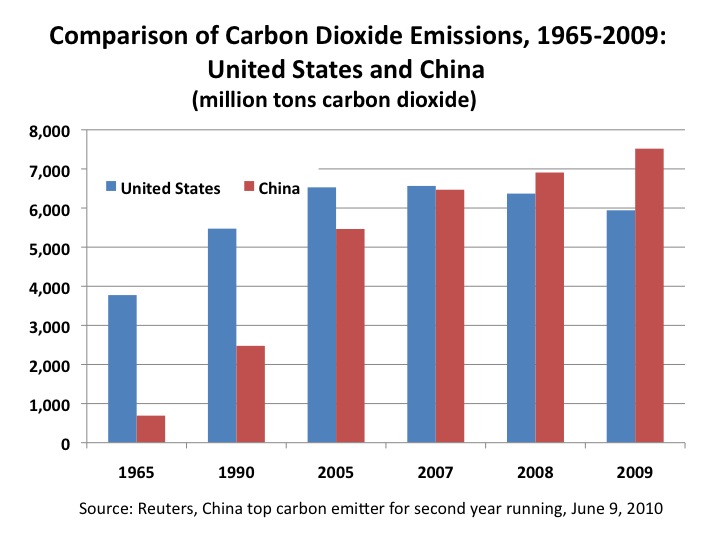
- China’s carbon dioxide emissions grew by 9.1 percent in 2009
- Carbon dioxide emissions in the United States declined by 6.5 percent mainly due to lower energy usage resulting from the recession.[v]
- China is not the only emerging country with increased emissions from carbon dioxide in 2009. India’s carbon dioxide emissions increased by 7 percent in 2009, Saudi Arabia’s by 5.4 percent, Iran’s by 4.6 percent, and Indonesia’s by 2.5 percent.
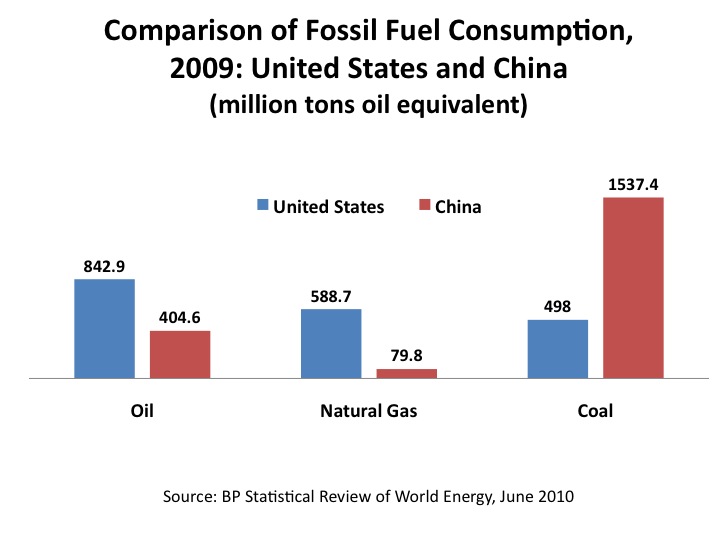
- China’s oil consumption increased by 6.7 percent in 2009, compared to a drop in the oil consumption of the United States by 4.9 percent.[vi]
- Global proved coal reserves are at the highest levels of all time. Global reserves of coal totaled 826,001 million tons at the end of 2009. This is 119 years of production at 2009 production levels and the United States has the largest share (28 percent) of these coal reserves.
Carbon Dioxide Emissions Fall in Developed Countries, Rise in Developing Countries
According to BP’s 2010 Statistical Review of World Energy,[vii] the global recession has not affected China’s thirst for fossil energy. Its subsequent emission of carbon dioxide, the largest component of greenhouse gas, is at an all-time high. China’s carbon dioxide emissions grew by 9.1 percent in 2009, while those of the United States declined by 6.5 percent primarily owing to lower energy usage resulting from the recession.[viii] [ix] Further, China was not the only emerging country with increased emissions of carbon dioxide in 2009. India’s carbon dioxide emissions increased by 7 percent in 2009, Saudi Arabia’s by 5.4 percent, Iran’s by 4.6 percent, and Indonesia’s by 2.5 percent.
Unlike the United States Congress and the administration, these emerging countries are not under the delusion that cap-and-trade or other tax-like policies for reducing greenhouse gas emissions are either good for their economies or that their unilateral action in reducing emissions would make a dent in lowering future temperatures. The American Power Act, a legislative proposal sponsored by Senators Kerry and Lieberman, has as its goal to reduce greenhouse gas emissions 83 percent below 2005 levels by 2050. That would reduce temperatures by only one-fifth of one degree Fahrenheit by 2100, a scientifically meaningless amount.[x]
BP’s Statistics for Global Energy Consumption
In 2009, global consumption of oil, natural gas, and nuclear power declined, while global coal consumption remained almost flat, and renewable consumption increased modestly. The increase in non-hydroelectric renewable consumption resulted from government subsidies and mandates, stimulus funding, feed-in tariffs requiring that renewable energy be purchased at higher than average retail electricity prices to cover their cost, the United Nations’ Clean Development Program (under which wealthy nations pay developing countries to construct renewable power projects), and other incentives.
Oil. Global oil proved reserves at the end of 2009 totaled 1,333.1 billion barrels, the largest ever recorded by BP. Including Canadian oil sands brings total oil reserves to 1,476 billion barrels.[xi] (Proved oil reserves are those quantities of oil that geological and engineering information indicates can be recovered from known reservoirs under current economic and operating conditions with reasonable certainty.) This level of reserves is enough to support global oil production at 2009 levels for over 45 years.[xii] However, history has shown that as more oil is consumed, new technology and exploratory methods are developed to keep increasing reserves.[xiii]
Even with this level of global oil reserves, global oil consumption declined by 1.7 percent (1.2 million barrels per day) in 2009, the largest decline since 1982. Oil consumption in the Organization for Economic Cooperation and Development (OECD) countries declined by 4.8 percent (2 million barrels per day) in 2009. That decline was only partially offset by non-OECD countries, who increased their oil consumption by 2.1 percent.[xiv] The developing countries that incurred higher oil consumption were led by China, India, and the Middle East. China’s oil consumption increased by 6.7 percent in 2009, compared to a drop in the oil consumption of the United States by 4.9 percent.[xv]
Owing to oil production cuts by the Organization for Petroleum Exporting Countries (OPEC), global oil production declined by 2.6 percent (2 million barrels per day) in 2009, the largest decline since 1982. Non-OPEC countries increased oil production in 2009 by 0.9 percent (450,000 barrels per day). The largest increase in world oil production in 2009 was by the United States, which increased oil production by 7 percent (462,000 barrels per day). Other increases in oil production in 2009 were largely in Russia, other ex-Soviet states, and Brazil. Russia became the largest producer of oil in the world in 2009, surpassing Saudi Arabia.[xvi]
Natural Gas. Global reserves of natural gas at the end of 2009 were 6,621 trillion cubic feet,[xvii] an increase of 1.2 percent, which would last about 63 years at 2009 world production levels.[xviii] Global consumption of natural gas fell by 2.1 percent in 2009,[xix] the largest decline on record, and OECD consumption fell by 3.1 percent, the largest decline since 1982.[xx]
Global natural gas production declined by 2.1 percent in 2009, the first time on record, owing mainly to lower production by Russia (12.1 percent) and Turkmenistan (44.8 percent), which resulted from lower demand in Russia and Europe. Europe’s demand for Russian gas was less both because of the recession and because of competition from liquefied natural gas.[xxi]
The United States surpassed Russia as the largest producer of natural gas, having recorded the largest global increase in natural gas production for the third consecutive year, owing to increases in unconventional supplies such as shale gas. The United States increased its natural gas production in 2009 by 3.5 percent, according to BP.[xxii]
Surprisingly, the United States is reported to have had the largest 2009 increase in both oil and natural gas production of any country. With technologies such as horizontal drilling and hydraulic fracturing, production of shale gas has increased the availability of natural gas in the United States. But policies by the U.S. Government could make these increases disappear quickly by limiting off-shore and on-shore leasing, establishing moratoria and increasing costs and regulations on offshore drilling, and moving to restrict practices such as the hydraulic fracturing of wells, which has led to huge new supplies of natural gas.
Coal. Global reserves of coal totaled 826,001 million tons at the end of 2009, resulting in 119 years of production at 2009 production levels. Global coal consumption declined slightly in 2009, owing primarily to OECD’s reduced consumption of 10.4 percent and the Former Soviet Union’s decline of 13.3 percent, the largest declines on record, resulting from the recession and from the competition of natural gas. These reductions in coal consumption were counterbalanced by increased consumption of 7.4 percent in the rest of the world, of which China represented 95 percent.[xxiii]
China’s coal consumption in 2009 was 1,537 million tons oil equivalent, higher than its consumption level in 2008 by 9.6 percent. That level is 3 times the amount of coal consumed in the United States in 2009. U.S. coal consumption was 498 million tons oil equivalent in 2009, 11.5 percent lower than its consumption of coal in 2008. As a share of world consumption, China consumed 46.9 percent compared to 15.2 percent for the United States.[xxiv] No wonder that China has exceeded the United States in emissions of carbon dioxide.
Nuclear. Nuclear output declined 1.3 percent globally in 2009 with only countries in Asia increasing their nuclear output. For example, China’s nuclear power output increased 2.8 percent, India’s increased 10.7 percent, and Japan’s increased 9.4 percent. [xxv]
Hydroelectricity. Hydroelectric output increased 1.5 percent globally in 2009. China’s quantitative increase was the largest (5.5 percent), followed by Brazil (6.1 percent).[xxvi] Both water levels and new capacity additions affect increases in hydroelectric output.
Other renewable energy. BP does not include in their consumption statistics other renewable energy, such as biomass, wind, solar, and geothermal, because those estimates can be unreliable for some renewable resources. BP indicates, however, that global wind capacity increased by 31 percent in 2009, global solar capacity increased 47 percent, and global ethanol production increased 8 percent.[xxvii] While these were major percentage increases for wind and solar power, because of their low capacity factors (that is, the amount of generation obtained per unit of capacity), they remain a small portion of total world-wide consumption.
Conclusion
According to BP’s chief economist, Christof Ruehl, “The shift toward the developing world continues.”[xxviii] In 2009, many of the developing countries increased their energy consumption, particularly of fossil fuels, even with the global recession. China, for example, whose GDP increased by 8.7 percent in 2009,[xxix] fueled the growth by increasing its oil consumption by 6.7 percent, its natural gas consumption by 9.4 percent, its coal consumption by 9.6 percent, its nuclear output by 2.8 percent, and its hydroelectric output by 5.5 percent. While it added 13 gigawatts of wind power capacity,[xxx] a 9 percent increase in carbon dioxide emissions indicates that wind was not a major supplier of China’s energy in 2009. China’s government is clearly not hampered by policies and legislative proposals that would limit its economic growth by reducing its fossil fuel consumption to save only a fifth of one degree Fahrenheit by 2100. At some point, opinion leaders in the United States may be forced to confront the reality that energy consumption and economic growth go hand-in-hand.
[i] BP Statistical Review of World Energy, June 2010, http://www.bp.com/liveassets/bp_internet/globalbp/globalbp_uk_english/reports_and_publications/statistical_energy_review_2008/STAGING/local_assets/2010_downloads/statistical_review_of_world_energy_full_report_2010.pdf
[ii] BP Statistical Review of World Energy, June 2010, http://www.bp.com/liveassets/bp_internet/globalbp/globalbp_uk_english/reports_and_publications/statistical_energy_review_2008/STAGING/local_assets/2010_downloads/statistical_review_of_world_energy_full_report_2010.pdf
[iii] BP Statistical Review of World Energy, June 2010, http://www.bp.com/liveassets/bp_internet/globalbp/globalbp_uk_english/reports_and_publications/statistical_energy_review_2008/STAGING/local_assets/2010_downloads/statistical_review_of_world_energy_full_report_2010.pdf
[iv] BP Press Release, Recession Drove 2009 Energy Consumption Lower, June 9, 2010, http://www.bp.com/genericarticle.do?categoryId=2012968&contentId=7062811
[v] Reuters, China top carbon emitter for second year running, June 9, 2010, http://alertnet.org/thenews/newsdesk/LDE6580Y1.htm
[vi] BP Statistical Review of World Energy, June 2010, http://www.bp.com/liveassets/bp_internet/globalbp/globalbp_uk_english/reports_and_publications/statistical_energy_review_2008/STAGING/local_assets/2010_downloads/statistical_review_of_world_energy_full_report_2010.pdf
[vii] BP Statistical Review of World Energy, June 2010, http://www.bp.com/liveassets/bp_internet/globalbp/globalbp_uk_english/reports_and_publications/statistical_energy_review_2008/STAGING/local_assets/2010_downloads/statistical_review_of_world_energy_full_report_2010.pdf
[viii] Reuters, China top carbon emitter for second year running, June 9, 2010, http://alertnet.org/thenews/newsdesk/LDE6580Y1.htm
[ix] These figures are most likely low because BP does not include cement production in its carbon data, an industry that makes up about 10 percent of total carbon dioxide emissions.
[x] The American Power Act: A Climate Dud, May 12, 2010,
http://www.masterresource.org/2010/05/the-american-power-act-a-climate-dud/
[xi] BP Statistical Review of World Energy, June 2010, http://www.bp.com/liveassets/bp_internet/globalbp/globalbp_uk_english/reports_and_publications/statistical_energy_review_2008/STAGING/local_assets/2010_downloads/statistical_review_of_world_energy_full_report_2010.pdf
[xii] BP Press Release, Recession Drove 2009 Energy Consumption Lower, June 9, 2010, http://www.bp.com/genericarticle.do?categoryId=2012968&contentId=7062811
[xiii] Institute for Energy research, Has Oil Reached Its Peak?, https://www.instituteforenergyresearch.org/2008/08/26/has-oil-reached-its-peak/
[xiv] BP Statistical Review of World Energy, June 2010, http://www.bp.com/liveassets/bp_internet/globalbp/globalbp_uk_english/reports_and_publications/statistical_energy_review_2008/STAGING/local_assets/2010_downloads/statistical_review_of_world_energy_full_report_2010.pdf
[xv] BP Statistical Review of World Energy, June 2010, http://www.bp.com/liveassets/bp_internet/globalbp/globalbp_uk_english/reports_and_publications/statistical_energy_review_2008/STAGING/local_assets/2010_downloads/statistical_review_of_world_energy_full_report_2010.pdf
[xvi] Ibid.
[xvii] BP Statistical Review of World Energy, June 2010, http://www.bp.com/liveassets/bp_internet/globalbp/globalbp_uk_english/reports_and_publications/statistical_energy_review_2008/STAGING/local_assets/2010_downloads/statistical_review_of_world_energy_full_report_2010.pdf
[xviii] BP Press Release, Recession Drove 2009 Energy Consumption Lower, June 9, 2010, http://www.bp.com/genericarticle.do?categoryId=2012968&contentId=7062811
[xix] Percent changes and world shares are calculated by BP based on million tons of oil equivalent figures.
[xx] BP Statistical Review of World Energy, June 2010, http://www.bp.com/liveassets/bp_internet/globalbp/globalbp_uk_english/reports_and_publications/statistical_energy_review_2008/STAGING/local_assets/2010_downloads/statistical_review_of_world_energy_full_report_2010.pdf
[xxi] Ibid.
[xxii] Ibid.
[xxiii] Ibid.
[xxiv] Ibid.
[xxv] Ibid.
[xxvi] Ibid.
[xxvii] Ibid.
[xxviii] BP Press Release, Recession Drove 2009 Energy Consumption Lower, June 9, 2010, http://www.bp.com/genericarticle.do?categoryId=2012968&contentId=7062811
[xxix] The Washington Post, China may have dug a financial hole, June 18, 2010, http://www.washingtonpost.com/wp-dyn/content/article/2010/06/17/AR2010061705794.html
[xxx] Global Wind Energy Council, Global wind power boom continues amid economic woes, March 2, 2010, http://www.gwec.net/index.php?id=30&no_cache=1&tx_ttnews[tt_news]=247&tx_ttnews[backPid]=4&cHash=1196e940a0
