
Download the PDF of this testimony: Green Energy Competition Testimony
The Institute for Energy Research (IER) is a non-profit organization that conducts historical research and evaluates public policies in energy markets. IER articulates free market positions that respect private property rights and promote efficient outcomes for energy consumers and producers. IER staff and scholars educate policymakers and the general public on the economic and environmental benefits of free market energy. The organization was founded in 1989 as a public foundation under Section 501(c)(3) of the Internal Revenue Code. Funding for the institute comes from tax-deductible contributions of individuals, foundations, and corporations.
In an effort to garner support for implementing policies to advance renewable generation in lieu of traditional sources, the Administration and others paint an ominous picture of the U.S.-vs.-China clean energy race, implying that China is beating the country in that race.[1] However, all the facts are not on the table. Data from the Energy Information Administration indicates that in 2007, 2008 and 2009, the U.S. added more non-hydroelectric renewable capacity than was added in natural gas, coal, oil, and nuclear.[2] By the end of 2009, the U.S. was number one in the world with respect to wind capacity (China’s wind capacity over 25 percent less than the U.S. level).[3] Similarly, by the end of 2009, the U.S. was at the top in terms of solar capacity, ranking fourth only behind Germany, Spain, and Japan.[4] Where China is outdoing us in utility capacity is in coal-fired, nuclear, and hydroelectric generating technologies. Legal and bureaucratic red tape, makes it is much more difficult to build these energy technologies in the United States than in China. China is eclipsing the United States in all forms of energy, and especially the most cost-efficient energy sources. For example, their skills to quickly permit energy projects allow them to build the cleanest and most efficient coal plants.[5]
China realizes that it needs affordable energy to fuel its economic growth and manufacturing productivity, and it is building all forms of generating technologies at breakneck speed. By contrast, the electric generating construction program in the United States has slowed tremendously, owing to regulatory, financial, legal and demand problems. Economic growth has slowed significantly in the United States and with it our energy demand has grown more slowly. History shows that the United States became the world’s workshop – replacing Britain – shortly after we became the world’s largest consumer of energy. Since energy is literally, “the capacity to do work,” the United States needed enormous amounts of energy in the 20th century to do more work than our competitors, and ended up the lone superpower in the world. Policymakers need to understand that energy availability and affordability spur economic growth. Without reasonably priced energy, it will be difficult to achieve high levels of economic growth in the United States, and industry will move offshore where energy is more affordable, taking jobs away when we can least afford to lose them.
As the following chart illustrates, the use of energy to propel the U.S. economy and increase the capacity to do work led to unprecedented growth and opportunity. Of note is the fact that the U.S. economy once ran entirely on renewable forms of energy from well before our founding until well after the Civil War, at which time the advent of new forms of concentrated energy enabled us to surpass Britain in energy consumption and economic output. It is therefore important to understand China’s energy path today realistically. A recent report by the International Energy Agency indicated that China consumed more energy than the United States last year– the first time since 1885 that the United States was no longer the number one user of energy. For perspective, 10 years ago the United States used twice as much energy as China, according to Faith Birol, the chief economist of the International Energy Agency.

Comparison of Generating Capacity Data for the U.S. and China
Energy Information Administration data for 2008 (the most recent year available) indicates that China added more than 5 times the total generating capacity that the United States did (79 gigawatts of total capacity for China, versus 15 gigawatts of capacity for the United States). [6] While that statistic is in itself interesting, the split between fuel types is even more interesting. Embedded in this is China’s 26 gigawatts of hydroelectric capacity, while the U.S. added none. China also added 47 gigawatts of thermal capacity (primarily coal), while the U.S. added 6 gigawatts (primarily natural gas). That’s almost 8 times more thermal capacity and on a carbon dioxide-emitting basis, over 15 times more. With respect to wind, China added 6 gigawatts, while the United States 8 gigawatts.
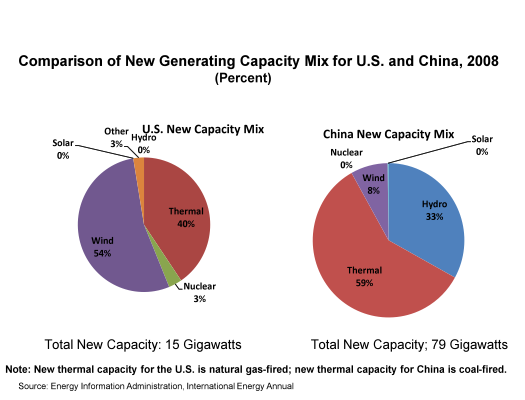
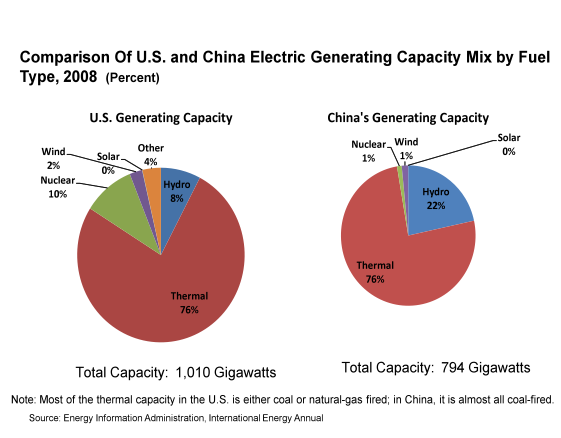
So, based on an apples-to-apples comparison of newly built capacity in 2008, China is out stripping us in hydroelectric and coal-fired capacity, which the Administration and environmental organizations fail to mention. Not only did they build more hydroelectric and coal-fired capacity in 2008 than we did, but their total hydroelectric capacity is over twice that of the United States, and as of the end of 2008, their coal-fired capacity was almost twice that of the United States. The chart below provides a comparison of the total capacity mix of the two countries.
Why is China Building Wind and Solar Capacity?
China builds wind and solar partly because ratepayers in other countries are paying them to do so. China has been taking advantage of the Clean Development Mechanism (CDM) under the Kyoto Protocol to obtain funding for its solar and wind power.[7] Under this program, administered by the United Nations, wealthy countries can contribute funds and get credit for “clean technology” built elsewhere as long as it is additional, that is, as long as that technology would not have been built otherwise. China is the world’s largest beneficiary of the program and has benefited to the point where 30 percent of its wind capacity is not operable because it is not connected to the grid.[8] However, in mid 2009, the U.N. started questioning whether the Chinese CDM program was in fact “additional,” because the U.N. found that China was lowering its subsidies to qualify for the program.[9] That is, China was reducing its own government’s support in order to get international subsidies.
What are China’s Electric Construction Plans?
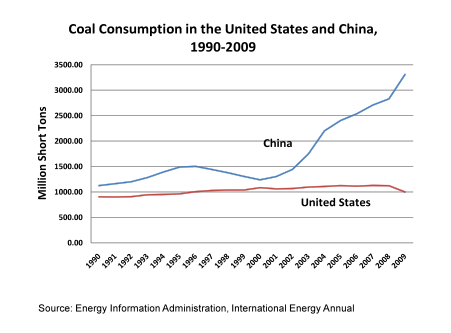
Both China’s generating sector and its industrial sector rely heavily on coal, with 80 percent of its electric generation being coal-fired.[10] They already consume over three times the amount of coal the United States consumes. See graph below. And the Members of this Committee know well that China already surpasses the United States in carbon dioxide emissions, and the gap is growing daily, as economic growth fed by new energy and mineral supplies transforms the lives and futures of hundreds of millions of Chinese, just as the use of these materials once did in the United States.
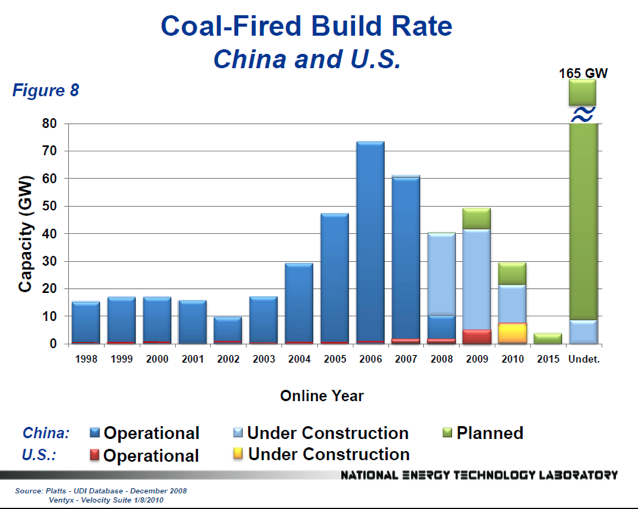
According to the Department of Energy’s National Energy Technology Laboratory (NETL), from 2004 through 2007, China has been building 30 to 70 gigawatts of coal-fired power a year, and has about 70 gigawatts more under construction. NETL sees China building over 185 gigawatts of coal-fired plants in the future.[11] (See figure below.)
According to Australia, China is planning to build 500 coal-fired plants over the next ten years.[12] That means: every week or so, for the next decade, China will open another large coal-fired power plant. Australia signed a $60 billion deal with China to build a coal mine in Queensland and a 311-mile rail way for transporting the coal to the coast for export to China’s power plants.[13]
While China has been slow in adding nuclear power plants, it currently has 24 nuclear reactors under construction and more starting construction soon.[14] Four AP 1000 reactors are under construction at 2 different sites: Haiyang and Sanmen.[15] These are the same reactors that the U.S. Nuclear Regulatory Commission (NRC) has ruled need additional analysis, testing, or design modifications of the shield building to ensure compliance with NRC requirements before they can be constructed in the United States.[16] China expects to achieve a total nuclear capacity of 80 gigawatts by 2020, and 200 gigawatts by 2030,[17] double the total nuclear capacity of the United States.
The Chinese government has set a target for 300 gigawatts of hydroelectric capacity by 2020. According to the Energy Information Administration, the Chinese government has sufficient projects underway to meet that target.[18]
China has a goal to produce 15 percent of its energy from non-hydroelectric renewables by 2020.[19] According to the Global Wind Energy Council, China installed 13 gigawatts of wind capacity in 2009, just 3 gigawatts more than the United States. China’s original goal of 30 gigawatts of wind capacity by 2020 was increased to 100 gigawatts as of May 2009. However, forecasters at the Energy Information Administration are discounting the goal due to the fact that 30 percent of their wind capacity isn’t connected to the grid. [20]
Solar technologies have barely gotten off the ground in China, but the Chinese Ministry of Finance plans to provide large subsidies for grid-connected solar.[21] First Solar, the world’s largest maker of thin-film solar power modules, announced last year that it would build a 2,000-megawatt photovoltaic plant in China, with completion scheduled for 2019. Construction on the first phase was to have begun on June 1, 2010, but the company wanted China to subsidize the project through feed-in tariffs[22], which it believed were essential for the viability of the project. China has since moved past their original memorandum of understanding with First Solar and is seeking bids for the project.[23] Like the United States, it seems, China often announces wind and solar projects that do not come to fruition. As in the case of many of the U.S. states that have renewable energy mandates, the goals are not often reached.
Prospects for Electric Capacity in the United States
The United States has made it difficult to build generating plants in this country, particularly coal-fired and nuclear power plants. According to NETL, only eight coal-fired plants totaling 3,218 megawatts became operational in the United States in 2009, but this was the largest increase in coal-fired capacity additions in one year since 1991.[24] Prospects of cap-and-trade legislation, reviews and re-reviews by the Environmental Protection Agency, direct action protests, petition drives, renewable portfolio mandates in many states, competition from subsidized and mandated wind power, and lawsuits have slowed the construction of new coal-fired plants.[25] As of late February, activists had derailed 97 of the 151 new plants that were in the pipeline in May 2007. According to the Sierra Club, 126 coal plants have been stopped since 2001. And, for the first time in more than 6 years, not one new coal plant broke ground in 2009. The graph above compares the coal-plant additions in the United States to that of China, showing only a handful of coal plants under construction in the United States. Because the capital cost of most of our coal-fired plants has been paid, that fleet produces almost 50 percent of our electricity at very little cost. Average production costs for coal-fired generators in 2009 were only 2.97 cents per kilowatt hour, slightly higher than our nuclear plants at 2.03 cents per kilowatt hour[26].
No nuclear plant has started up in the U.S. since 1996, and no construction permits have been issued since 1979. NRC requirements, financing difficulties, and slow fulfillment of the nuclear provisions of the Energy Policy Act of 2005 have slowed the construction of new nuclear power reactors. However, as part of the 2005 Energy Policy Act, President Obama announced earlier this year that his administration is offering conditional commitments for $8.33 billion in loan guarantees for nuclear power construction and operation. Two new 1,100 megawatt Westinghouse AP1000 nuclear reactors are to be constructed at the Alvin W. Vogtle Electric Generating Plant in Burke, Georgia, supplementing the two reactors already at the site. The two new nuclear generating units are expected to begin commercial operation in 2016 and 2017 at a cost of $14 billion. As part of the conditional loan guarantee deal, the U.S. Nuclear Regulatory Commission must determine if the AP1000 fulfills the regulatory requirements for a construction and operating license. (These are the same units permitted, licensed, and being constructed in China right now.) But, as a recent Wall Street Journal energy conference noted, loan guarantees are “meaningless in the absence of regulatory certainty.” [27]
Natural gas and wind power are the technologies that seem best able to surmount the financial, regulatory, and legal hurdles of getting plants permitted and operational in the United States. However, organized local opposition has halted even some renewable energy projects by using “not in my back yard” (NIMBY) issues, changing zoning laws, opposing permits, filing lawsuits, and bleeding projects of their financing.[28]
Generating Costs of New Technologies
According to the Energy information Administration (EIA), the annualized cost of solar photovoltaic technology is 39.61 cents per kilowatt hour (in 2008 dollars), and solar thermal is about 35 percent less: 25.66 cents per kilowatt hour. Offshore wind is expected to cost less than the solar technologies, 19.11 cents per kilowatt hour, and onshore wind is less at 14.9 cents per kilowatt hour. These costs are levelized costs, which is the present value of the total cost of building and operating a generating plant over its financial life, converted to equal annual payments and amortized over expected annual generation. The EIA estimates these costs for the year 2016, which is the first future year that generating technologies can be compared because of the different lead times for building the plants. Some plants, such as photovoltaic plants, require 1 or 2 years to build, while others (such as nuclear plants) require 6 or more year[29]
The costs for new solar and wind technologies are higher than the costs of competing technologies. For 2016, natural gas combined-cycle technologies have costs estimated at 7.93 to 8.31 cents per kilowatt hour, and pulverized coal and coal-fired integrated gasification combined-cycle technologies have costs of 10.04 and 11.05 cents per kilowatt hour, respectively. EIA includes a 3-percentage point increase in the cost of capital when evaluating investments in greenhouse gas intensive technologies to represent the difficulties in obtaining financing, which is equivalent to a $15 per ton carbon dioxide emission fee; EIA includes a 2 percentage point reduction in the cost of capital for eligible renewable technologies, because of the loan guarantee program of the Stimulus Act. [30] (See figure below.)
If one considers just the capital cost of building these plants, without finance charges, the EIA estimates those at $6,171 per kilowatt (in 2008 dollars) for photovoltaic technology, $5,132 per kilowatt for solar thermal technology, and $3,937 for offshore wind.[31] Of course, plant costs can vary depending on site locations, terrain, labor costs, and other factors. For a solar photovoltaic plant that came on line last October in southern Florida, Florida Power and Light spent $152 million building a 25-megawatt plant, which is equivalent to $6,080 per kilowatt.[32]

If constructed, the Cape Wind project, off the coast of Cape Cod in Massachusetts, would be the first offshore wind farm in the United States. The 130-turbine wind farm is estimated to cost at least $2 billion and was approved this year by Interior Secretary Ken Salazar after more than eight years of federal review. The Massachusetts Department of Public Utilities will begin considering this month whether Cape Wind is a good deal for ratepayers. The utility company is to buy half of Cape Wind’s power, starting at 18.7 cents per kilowatt hour,[33] slightly less than EIA’s estimate of 19.11 cents per kilowatt hour. But that’s still about twice what the utility pays for power from conventional sources, and almost twice the average U.S. cost of electricity—9.9 cents per kilowatt in 2009.[34]
Summary
China is on a fast track to bring online new generating units using coal, nuclear, hydroelectric, solar, and wind power, which will allow its economy to continue to grow. They have enormous potential supplies of shale gas, the production of which has been revolutionized by the application of hydraulic fracturing. Unlike in the United States, where natural gas production is under attack, the Chinese are luring U.S. technology to China to develop their resources. However, because China is endowed with a sizable amount of coal resources and because coal is the cheapest energy source in China, coal-fired generating additions will far outpace those of other technologies. By continuing to rely heavily on currently available coal technology, China will remain the number one emitter of carbon dioxide, more than doubling its current carbon dioxide emissions by 2035, according to forecasts from the Energy Information Administration. China’s carbon dioxide emissions are already 5 percent higher than those of the United States, and by 2035, they are expected to be over twice that of the United States.[35]
The United States, on the other hand, has made it difficult to build generating plants in this country. Prospects of cap-and-trade legislation and reviews and re-reviews as well as changing emissions requirements by the Environmental Protection Agency have slowed the construction of new coal-fired plants. NRC requirements, financing difficulties, and slow fulfillment of the nuclear provisions of the Energy Policy Act of 2005 have slowed the construction of new nuclear power reactors. Even renewable energy projects have been halted by “not in my back yard” (NIMBY) protesters. They have blocked energy projects by organizing local opposition, changing zoning laws, opposing permits, filing lawsuits, and bleeding projects dry of their financing. Without reasonably priced energy, it will be difficult to achieve high levels of economic growth, and U.S. industry will just move offshore where energy is more affordable.
The US became the world’s most productive economy by using its energy resources to increase output and make life better for our citizens. Contrary to the claims of some, the Chinese are not fixated on “green technology” solely, and in fact, are growing other parts of their energy mix much more extensively than their relatively small non-hydro renewable energy sources. The truth is, the Chinese are building everything much more quickly than the United States, and are using energy to build an economy for the future.
At IER, we urge Members of the Committee to look at his matter comprehensively, since history tells us energy consumption is directly linked with economic growth. Should the United States choose to concentrate solely on a path of expensive energy sources for our future “capacity to do work,” our nation will do less work. That is a stark departure from the path that led and sustained our position in the world, and has implications far beyond those related to energy security.
Thank you for the opportunity to supply this testimony for the Committee’s use.
[1] Climate Wire, Energy policy: U.S. clean tech outpaced by China—Chu, March 9, 2010, http://www.eenews.net/climatewire/2010/03/09/3
[2] Energy Information Administration, Annual Energy Review 2009, Table 8.11a, http://www.eia.gov/emeu/aer/pdf/pages/sec8_42.pdf
[3] Global Wind Energy Council, Global Wind Report 2009, http://www.gwec.net/fileadmin/documents/Publications/Global_Wind_2007_report/global_installed_wind_power_capacity_2008-09.jpg
[4] Solar Energy Industries Association, US Solar Industry: Year in Review 2009, April 15, 2010, http://seia.org/galleries/default-file/2009%20Solar%20Industry%20Year%20in%20Review.pdf
[5]New York Times: China Outpaces US in Cleaner Coal-Fired Plants-May 10, 2009 http://www.nytimes.com/2009/05/11/world/asia/11coal.html
[6] Energy Information Administration, International Energy Annual, preliminary data.
[7] CNN, U.N. halts funds to China wind farms, December 2, 2009, http://edition.cnn.com/2009/BUSINESS/12/01/un.china.wind.ft/index.html
[8] The Wall Street Journal, “China’s Wind Farms Come with a Catch: Coal Plants”, September 28, 2009, http://online.wsj.com/article/SB125409730711245037.html
[9] CNN, U.N. halts funds to China wind farms, December 2, 2009, http://edition.cnn.com/2009/BUSINESS/12/01/un.china.wind.ft/index.html
[10] Energy information Administration, International Energy Outlook 2010, Tables H11 and H14, http://www.eia.doe.gov/oiaf/ieo/index.html
[11] National Energy Technology Laboratory, Tracking New Coal-fired Power Plants, January 8, 2010, http://www.netl.doe.gov/coal/refshelf/ncp.pdf
[12] http://windfarms.wordpress.com/2009/01/29/china-building-500-coal-plants/
[13] Australia Signs Huge China Coal Deal, http://windfarms.wordpress.com/2010/02/06/australia-signs-huge-china-coal-deal/
[14] Nuclear Power in China”, World Nuclear Association, August 20, 2010, www.world-nuclear.org/info/inf63.html
[15] Westinghouse News Releases, “Westinghouse and the Shaw Group Celebrate First Concrete Pour at Haiyang Nuclear Site in China”, September 29, 2009, http://westinghousenuclear.mediaroom.com/index.php?s=43&item=200
[16] Westinghouse Statement Regarding NRC News Release on AP1000 Shield Building, http://westinghousenuclear.mediaroom.com/index.php?s=43&item=203
[17] Nuclear Power in China, World Nuclear Association, August 20, 2010, www.world-nuclear.org/info/inf63.html
[18] Energy Information Administration, International Energy Outlook 2010, page 88, http://www.eia.doe.gov/oiaf/ieo/index.html
[19] USA Today, “China Pushes Solar, Wind Power Development”, http://www.usatoday.com/money/industries/energy/environment/2009-11-17-chinasolar17_CV_N.htm
[20] Energy Information Administration, International Energy Outlook 2010, page 88, http://www.eia.doe.gov/oiaf/ieo/index.html
[21] Energy Information Administration, International Energy Outlook 2010, page 88, http://www.eia.doe.gov/oiaf/ieo/index.html
[22] Feed-in tariffs require electric utilities to purchase renewable electricity at a higher rate than retail in order for the renewable technology to overcome price disadvantages with more competitive technologies.
[23]http://www.thestreet.com/story/10835523/1/will-china-renege-on-first-solar-deal.html
[24] National Energy Technology Laboratory, Tracking New Coal-fired Power Plants, January 8, 2010, http://www.netl.doe.gov/coal/refshelf/ncp.pdf
[25] A messy but practical strategy for phasing out the U.S. coal fleet, http://www.grist.org/article/death-of-a-thousand-cuts/
[26] http://www.nei.org/resourcesandstats/documentlibrary/reliableandaffordableenergy/graphicsandcharts/uselectricityproductioncosts
[27] The Wall Street Journal, An Energy Head Fake, March 11,2010, http://online.wsj.com/article/SB10001424052748704784904575112144130306052.html?mod=WSJ_Opinion_AboveLEFTTop
[28] For a repository of stalled and stopped energy projects, see U.S. Chamber of Commerce, “Project No Project Energy-Back On Track”, http://pnp.uschamber.com/
[29] Energy Information Administration, 2016 Levelized Cost of New Generation Resources from the Annual Energy Outlook 2010, http://www.eia.doe.gov/oiaf/aeo/electricity_generation.html .
[30] Ibid.
[31] Energy Information Administration, Assumptions to the Annual Energy Outlook 2010, Table 8.2, http://www.eia.doe.gov/oiaf/aeo/assumption/index.html
[32] “Solar plant set to open, even as shadows loom”, Herald Tribune, Zac Anderson, Oct. 14, 2009, http://www.heraldtribune.com/article/20091014/ARTICLE/910141033/2055/NEWS?Title=Solar-plant-set-to-open-even-as-shadows-loom
[33] The Associated Press, Mass. court rejects challenge to Cape Wind permit, August 31, 2010, http://www.google.com/hostednews/ap/article/ALeqM5gz8VVwo2TgZdHn9MmdvajJdSGq2QD9HUN0TO3
[34] Energy Information Administration, Monthly Energy Review, Table 9.9, http://www.eia.gov/emeu/mer/pdf/pages/sec9_14.pdf
[35] Energy Information Administration, International Energy Outlook 2010, Table A10, http://www.eia.doe.gov/oiaf/ieo/index.html
