
BP recently released its Statistical Review of World Energy 2015[i] and found that consumption of fossil fuels in 2014 continued to increase despite primary energy consumption just 0.9 percent higher, which, absent the financial crisis, is the slowest growth of global energy demand since the late 1990s. Global oil consumption grew 0.8 percent in 2014, while natural gas and coal consumption each increased by 0.4 percent. Despite these increases, the leaders of the G7 countries (United States, Germany, France, UK, Italy, Canada, and Japan) agreed to phase out the use of fossil fuels by the end of the century.[ii]
According to BP, the United States is now the world leader in both oil and natural gas production, regaining the title in oil, which it last held in 1975. The United States produced 11.6 billion barrels of oil in 2014—an increase of 16 percent over 2013 levels–to overtake both Russia and Saudi Arabia—the latter producing 11.5 billion barrels. U.S. oil production grew by 1.6 million barrels per day, making the United States the only country in the world ever to record three consecutive years of 1 million barrel-a-day or more growth. U.S. oil production in 2014 exceeded the previous peak level of U.S. production set in 1970. The 11.6 billion barrels of U.S. oil production in 2014 is made up of oil, condensate, and natural gas plant liquids.
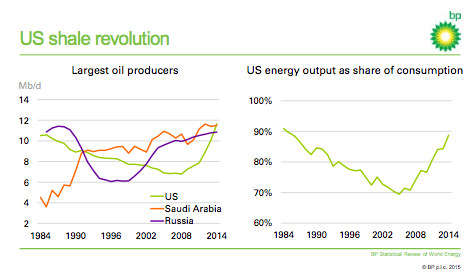
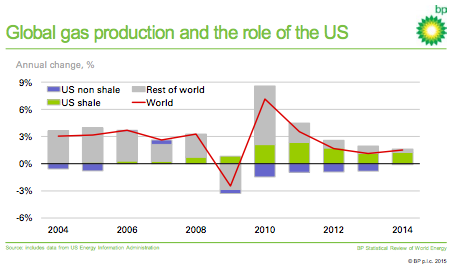
The United States surpassed Russia in 2009 as the world’s largest natural gas producer, leaving the United States as the undisputed leader in both oil and natural gas production. World natural gas production increased by 1.6 percent in 2014–four times the growth rate of global consumption–with the United States recording the largest production growth at 6.1 percent.
World Demand
The slow growth in energy demand occurred despite the global economy expanding at 3.3 percent—a similar rate to 2013. Energy consumption grew more slowly than recent averages in all regions except North America, where it increased 0.9 percent, and Africa, where it increased 2.8 percent. Primary energy demand in the European Union declined by 3.9 percent.
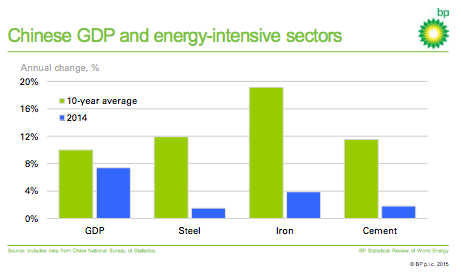
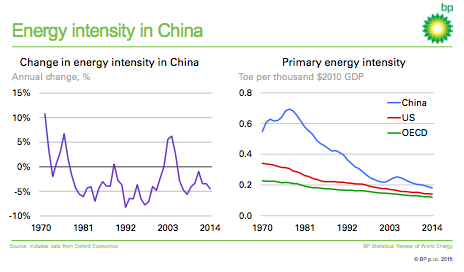
The slowdown in energy demand was primarily due to a decline in global energy intensity (energy consumption per unit of GDP) of 2.3 percent and a rebalancing of the Chinese economy. Chinese GDP growth slowed to 7.4 percent in 2014, significantly weaker than the double-digit growth rates China had been experiencing. This economic slowing in China was also accompanied by a shift in the pattern of growth, with industrial production in the energy-intensive sectors (steel, iron, and cement) decelerating sharply and the more service oriented sectors growing. This changing pattern of economic growth caused China’s energy consumption to slow to only a 2.6 percent increase in 2014– less than half its average of 6.6 percent over the past 10 years and the weakest rate of growth since the late 1990s.
World Supply
Energy production grew by 1.4 percent in 2014, slightly less than the growth in 2013 of 1.6 percent, and weaker than its 10-year average of 2.2 percent. This growth was marked by a sharp acceleration in oil supply that was offset by the first decline in coal production (-0.7 percent) since the Asian financial crisis in 1998. Supply growth was dominated by the developed world, which accounted for over 80 percent of the increase in supply.
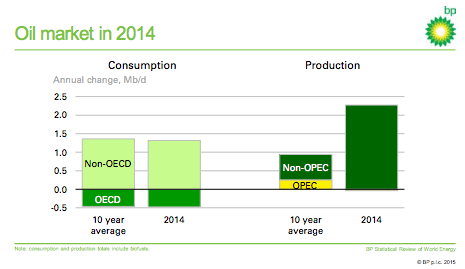
Oil. Global oil production growth in 2014 increased by over 2 million barrels per day–more than double its 10-year average. Non-OPEC production increased by 2.1 million barrels per day in 2014 – the largest increase on record. Besides the large growth in U.S. production, oil production in Canada was up by 315 thousand barrels per day and in Brazil by 232 thousand barrels per day, with output in both countries reaching record highs. In contrast, OPEC production was largely unchanged at 36.6 million barrels per day.
Gas. Despite the weak growth in global gas consumption–the weakest rate of growth for almost 20 years with the exception of the financial crisis–the growth in global gas production was relatively robust at 1.6 percent, resulting in a lowering of gas prices. This general weakening in gas prices coincided with a further narrowing of the differential between regional gas prices, reflecting the increasing integration of global gas markets.
The weakness in global gas demand was largely due to demand in the European Union (EU), which fell by almost 12 percent–the largest decline in EU demand on record. The decline in EU gas demand was mainly due to a mild winter, with heating degree days at one of their lowest levels on record. Gas imports to the EU also declined sharply, with pipeline imports from Russia and other suppliers declining almost 9 percent—also the largest decline on record.
While the EU saw weak gas demand, the United States increased its gas demand by almost 3 percent in 2014. Gas production in the United States increased by over 6 percent–almost double its 10-year average and accounted for almost 80 percent of the increase in global gas production. All of that growth was due to increases in shale gas, whose production increased by over 13 percent, with the vast majority of that growth coming from Marcellus and Utica shale formations.
Coal. Global coal consumption grew by just 0.4 percent–its slowest rate since the Asian crisis in 1998. Global coal production, on the other hand, declined by 0.7 percent mainly due to a decline in China’s coal production. China’s coal consumption grew by just 0.1 percent in 2014–compared to 2 percent in 2013 and a 74-percent increase since 2004—as output from the energy-intensive sectors in China declined. Coal also lost share in China’s electricity sector as a result of exceptionally strong growth in hydropower of 15.7 percent, as new capacity came on-line and high levels of rainfall increased utilization rates. As a result, China’s coal production declined by 2.6 percent. Coal prices in 2014 fell to their lowest level in 5 years.
Other countries, however, increased their production of coal. India’s coal consumption increased by 11.1 percent and its coal production increased by 6.4 percent–the largest increments to global demand and supply of coal. The majority of the increased demand for coal in India came from the power sector, where total power generation increased by almost 10 percent in 2014–its strongest rate of increase since 1989. Indonesia increased its coal production by 2 percent and Australia increased its production of coal by 4.7 percent.
Non-fossil fuels. Non-fossil fuels increased their output by 3.7 percent in 2014—above their 10-year average of 3.2 percent—but accounted for less than 15 percent of total primary energy. Global hydro power grew by 2.0 percent– slower than its 10-year average of 3.3 percent. While China increased its use of hydropower, weather reduced hydropower consumption in Brazil by 5.5 percent, Turkey by 32 percent and the United States by 3.7 percent.
Nuclear power grew by 1.8 percent, with the largest output increase in South Korea (12.7 percent) where three nuclear reactors were restarted. China also increased its nuclear capacity and its nuclear output. Despite this growth, global nuclear power remained 10 percent below its 2006 level.
Growth in non-hydro renewables (including biofuels) accounted for almost a third of the total increase in primary energy in 2014, and they provided more than 40 percent of the increase in power generation. Although renewable energy in power generation increased 12 percent in 2014, it was below its 10-year average of 15.3 percent growth and was its slowest growth rate since 2003. This slowdown was driven by wind, whose growth rate in 2014 was 10.2 percent–less than half its 10-year rate of 23.5 percent. Solar power increased its output by 38 percent in 2014. Non-hydro renewables accounted for just 3 percent of global primary energy in 2014.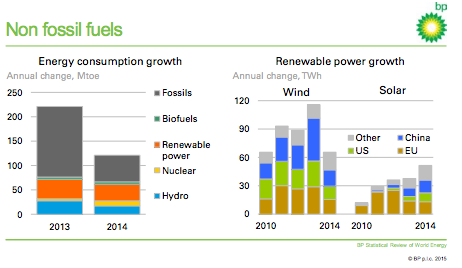
Conclusion
Despite the G7 interest in phasing out fossil fuels, fossil fuels continue to be used in global energy markets to provide increasing comfort and economic activity to nations and their citizens. India, for example, has indicated that it will use coal to bring electrification to much of its population without power. According to the Guardian[iii], 5 of the G7 countries increased their coal use between 2009 and 2013 but still demanded that poor countries slash their carbon emissions. Britain, Germany, Italy, Japan and France together burned 16 percent more coal in 2013 than 2009 and plan to construct more coal-fired power stations, according to the Guardian. Clearly, for many of the rich countries, it is do as I say and not as I do.
[i] BP, Statistical Review of World Energy 2015, June 2015, http://www.bp.com/en/global/corporate/about-bp/energy-economics/statistical-review-of-world-energy.html
[ii] Guardian, G7 leaders agree to phase out fossil fuel use by end of the century, June 8, 2015, http://www.theguardian.com/world/2015/jun/08/g7-leaders-agree-phase-out-fossil-fuel-use-end-of-century
[iii] Guardian, Five G7 nations increased their coal use over a 5-year period, research shows, June 8, 2015, http://www.theguardian.com/environment/2015/jun/08/five-g7-nations-increased-their-coal-use-over-a-five-year-period-research-shows
