
This April, the American Wind Energy Association (AWEA) released its Annual Market Report for 2015. In the report, the industry group lauded how “wind energy installed more electric generating capacity last year than any other energy source in America.” This fact sounds impressive, but it actually demonstrates wind power’s limited value. While wind added the most new generation capacity in 2015, natural gas increased the most in terms of actual electricity production.[1] Ultimately, generating reliable and affordable electricity is the best indicator of an energy source’s true value.
What’s So Important About Capacity Additions?
AWEA is correct that wind added the most generation capacity during 2015, but that figure misses the bigger picture. According to the U.S. Energy Information Administration (EIA), capacity speaks to the “the maximum electric output an electricity generator can produce under specific conditions.” Generally, capacity is described in terms of megawatts (MW), and estimates will often refer to a power plant’s “net summer capacity,” which assesses a particular plant’s maximum output during summer peak demand. Net generation conveys how much electricity a power plant actually produces over a period of time (minus the electricity needed to operate the plant), and it’s typically recorded in terms of both capacity and time (e.g., 100 megawatthours).
In 2015, EIA reported that wind represented 41 percent of new U.S. generating capacity in 2015 (natural gas contributed 30 percent and solar made up 26 percent of the total). Nevertheless, wind power is not the only energy source that’s adding significant amounts of capacity. Based on EIA data, natural gas actually added the largest share of new capacity over 2014 and 2015, accounting for 37 percent of the total (wind made up 33.5 percent).
While the wind industry consistently highlights the large volume of wind capacity additions, electricity generation from wind turbines is still remarkably small when compared to total U.S. electricity generation. In 2015, wind power provided only 4.7 percent of America’s electricity. Now, that’s certainly higher than a decade earlier (0.65 percent in 2006), but considering the billions of dollars in government subsidies the wind industry has received since 1992, such an increase is disappointingly low. IER estimated that the wind industry garnered at least $18.58 billion in cumulative subsidies between 2005 and 2014.
Despite years of capacity additions, wind power is still heavily dependent on government support. When the biggest handout for the wind industry—the Production Tax Credit (PTC)—temporarily expired at the end of 2012, capacity additions in 2013 precipitously dropped (as depicted in the following chart).
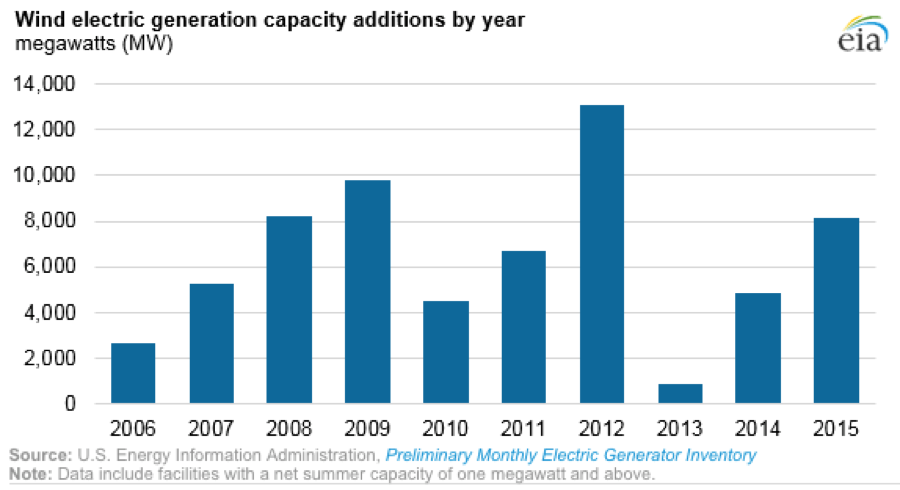
Source: EIA, Today In Energy, March 23, 2016
Similarly, wind capacity additions had previously skyrocketed in 2012 because wind developers were rushing to put projects in service before the PTC expired. Merely pointing to capacity additions as representative of wind’s growth and value leaves out key information.
Capacity vs. Generation
While capacity additions are necessary for growing an energy source’s contributions on the grid, actual electricity generation is a better indicator of a resource’s value. Coal, natural gas, and nuclear power still provide 86 percent of U.S. electricity generation, while wind remains below 5 percent.
Net generation from coal has been falling over the past decade, largely because of federal policies and cheaper natural gas prices (although EIA anticipates that coal will continue to be an important source of electricity through 2040). Natural gas has claimed the majority of coal’s declining portion of generation because of its affordability and reliability. In 2015, coal and natural gas both provided about 33 percent of U.S. electricity generation, as the following chart demonstrates. Although wind has steadily risen, it remains a small contributor of electricity.
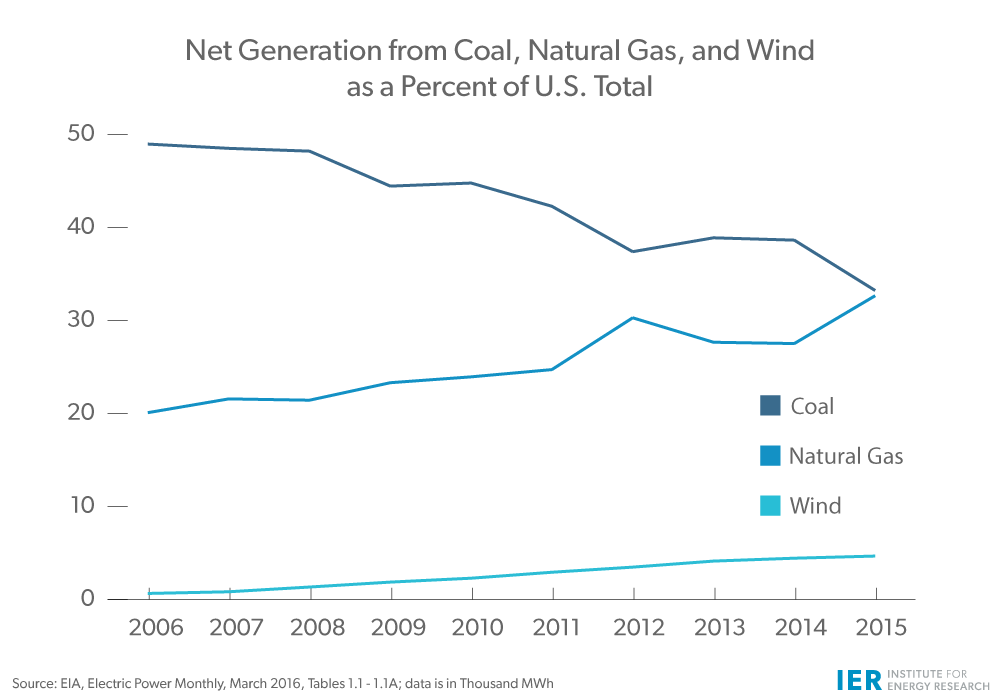
Source: EIA, Electric Power Monthly, March 2016, Tables 1.1–1.1.A; data is in Thousand MWh
Using the same data from EIA, the next chart depicts how the combined portion of net generation from coal and natural gas has stayed relatively constant, even as natural gas has increased its supply substantially. Total supply has also stayed relatively flat.
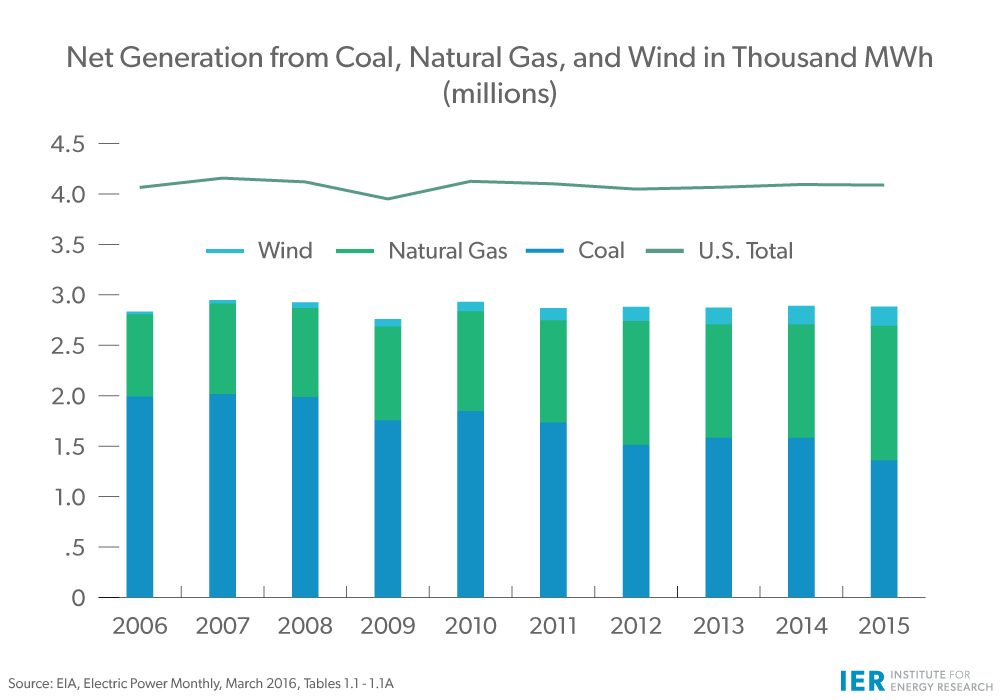
Source: EIA, Electric Power Monthly, March 2016, Tables 1.1–1.1.A
Last year, AWEA exclaimed, “Wind has more than tripled since 2008, it can double from where it is today to 10 percent by 2020, then double again to 20 percent by 2030.” Because wind’s initial generation was (and still is) so limited, it’s tenuous to point to it as an incredible success story—especially because of wind’s continuing reliance on subsidies. As AWEA is also quick to point out, the PTC “must” be rapidly extended “for as long as possible” to support wind’s growth.
In other words, doubling or even tripling an energy source’s generation isn’t very significant if its original output was infinitesimal. As an analogy, the Cleveland Spiders only won 20 games (out of 154 total) in 1899, finishing with the worst single-season record in Major League Baseball history. Even if their record were 250 percent higher that year, the Spiders would have still lost more games than they had won (i.e., 70–84). If you start with next to nothing, then even a small increase could be made to look important.
Furthermore, according to EIA, wind generation experienced its “smallest annual increase since at least 1999” in 2015—only 5.1 percent more than generation in 2014. Weather patterns in the western U.S. influenced this slower rate of growth, a trend that accentuates wind power’s inherent variability. By contrast, natural gas net generation grew by 18.5 percent between 2014 and 2015, demonstrating the resource’s value on the grid and its ability to produce reliable electricity.
Wind will also face diminishing returns as more and more capacity is added to the grid. Because wind turbines only produce electricity when the wind is blowing (i.e., they’re intermittent), they require other generators to provide essential backup generation and ensure that the electric grid remains stable and balanced. Thus, adding more wind will also require a consistent supply of reliable—or dispatchable—generation. The problem is that higher amounts of wind generation make reliable generators run less efficiently and even cause some to prematurely retire.
Wind turbines also run fewer hours a day than much of the generating capacity they displace. Intermittency typically causes renewables to have lower capacity factors—“the ratio of a fleet’s actual generation to its maximum potential generation”—than baseload or intermediate load generators. Thus, making reliable plants less efficient is a compounding problem: integrating a larger portion of renewables will also mean lower capacity factors for the dispatchable plants needed to continuously balance load.
Conclusion
The wind industry enjoys hyping capacity additions for wind but fails to effectively contextualize the value that wind turbines add to the electric grid. Despite decades of subsidies and large amounts of added capacity, wind power still generates less than 5 percent of total U.S. electricity. Ultimately, it’s actual generation, not just capacity, that’s important—a fact clearly demonstrated by the growing importance of natural gas.
Moreover, such reports from wind supporters don’t properly account for the inherent limitations of intermittent power or the imposed costs it places on the grid. Quite simply, if wind continues to add more and more capacity, when can wind’s actual generation be expected to catch up? Furthermore, can the electric grid accommodate increasingly higher amounts of wind capacity? In the end, prioritizing free market policies that accurately reflect an energy source’s true value is the best way to ensure America’s electricity generation is both affordable and reliable.
[1] U.S. Energy Information Administration, Monthly Energy Review, Table 7.2a Electricity Net Generation: Total (All Sectors), March 2016, http://www.eia.gov/totalenergy/data/monthly/pdf/sec7_13.pdf
