
On April 14, 2015, the Energy Information Administration (EIA) released its Annual Energy Outlook 2015 with projections through 2040.[i] Assuming that the Obama Administration’s plan to regulate carbon dioxide emissions for existing power plants is not in force, EIA finds that:
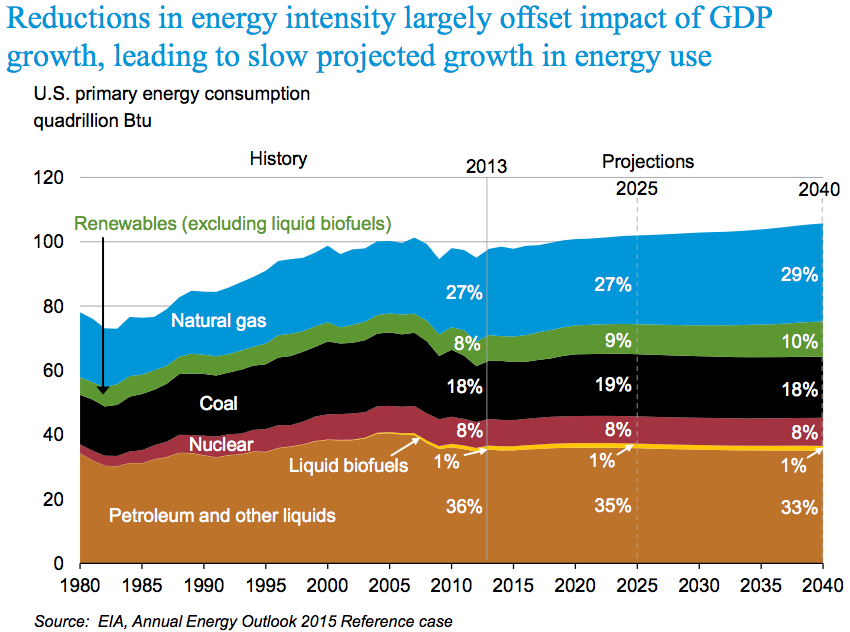
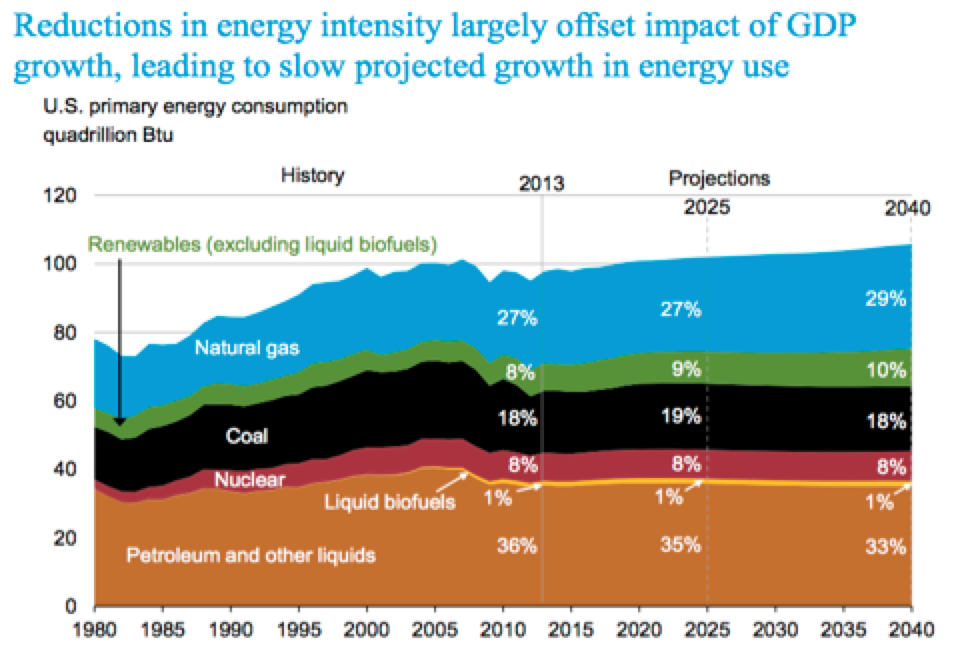
- Fossil fuels will remain dominant, supplying 80 percent of the nation’s energy in 2040, slightly less than their 82 percent share in 2014.
- Renewable energy increases its share from 8 percent in 2014 to just 11.8 percent in 2040 despite the subsidies and mandates that they receive.
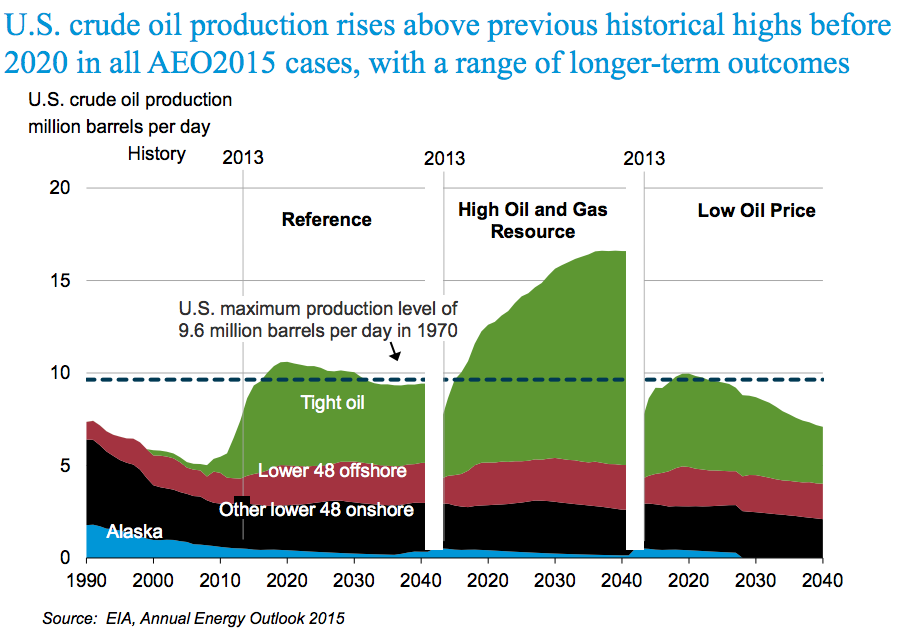
- Crude oil production peaks at 10.6 million barrels per day in 2020, and then moderates to 9.4 million barrels per day, higher than the agency expected in last year’s forecast.
- Net petroleum imports account for 14 percent of domestic liquid fuels consumption in 2020, down from 26 percent in 2014, due to strong growth in domestic production of crude oil from tight formations through 2020 and limited growth in domestic demand after 2020.
- The United States transitions from being a net importer of natural gas to a net exporter by 2017.
- Net energy imports of all fuels decline and end by 2030 for the first time since the 1950s.
Source: EIA, http://www.eia.gov/pressroom/presentations/sieminski_04142015.pdf
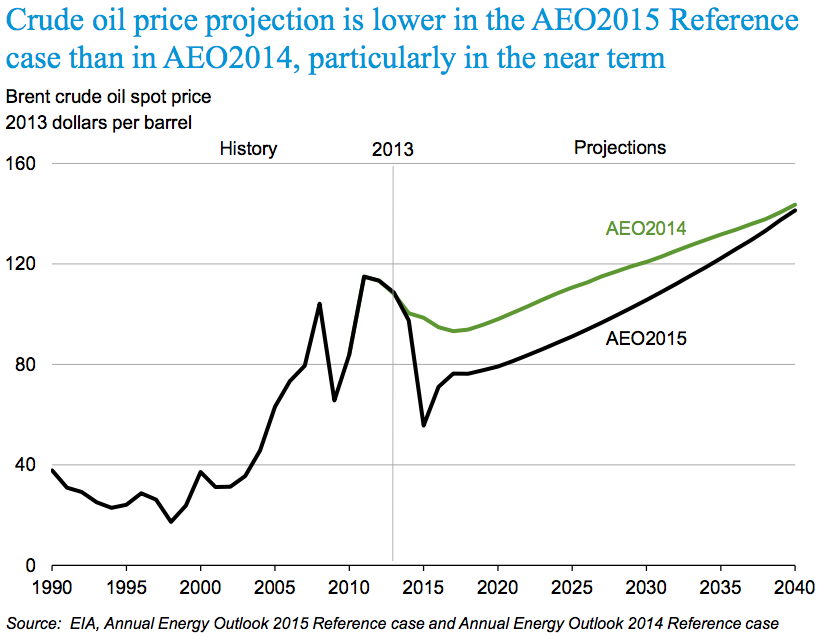
Oil Price Forecast
The world oil crude price (Brent) is expected to average $56 per barrel in 2015 and then increase due to growth in demand from developing countries. However, downward price pressure from continued increases in U.S. crude oil production keeps the Brent price below $80 per barrel (2013 dollars) through 2020. Although U.S. crude oil production is expected to decline after 2020, increased oil production from the Organization of Petroleum Exporting Countries (OPEC) and other oil producing countries holds the Brent price below $100 per barrel through 2028, after which it increases to $141 per barrel by 2040.
 Source: EIA, http://www.eia.gov/pressroom/presentations/sieminski_04142015.pdf
Oil Production
Crude oil production from tight (shale) formations leads the growth in total U.S. crude oil production. EIA considers 6 cases in AEO 2015, including a High Oil and Gas Resource Case.[1] In the High Oil and Gas Resource case, growth in tight oil production results in a 57 percent higher level of total crude oil production at its peak compared to the production peak in the Reference case. Crude oil production in the High Oil and Gas Resource case increases to 16.6 million barrels per day in 2040, compared with a peak of 10.6 million barrels per day in 2020 in the Reference case. In the Low Oil Price case, U.S. crude oil production totals 7.1 million barrels per day in 2040. (See chart below.)
Source: EIA, http://www.eia.gov/pressroom/presentations/sieminski_04142015.pdf
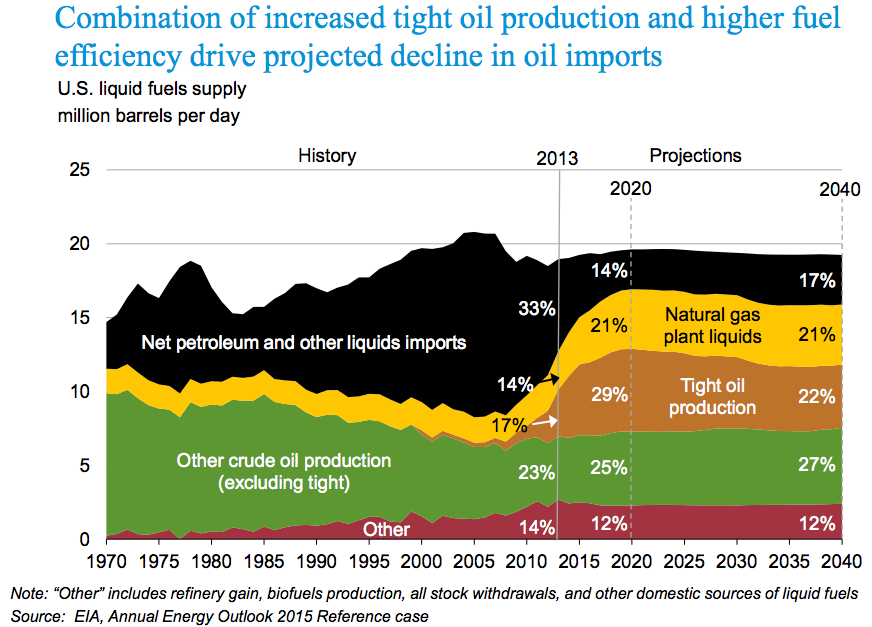
Crude Oil and Petroleum Product Imports
Lower levels of domestic consumption of liquid fuels and higher levels of domestic production of crude oil push the net import share of crude oil and petroleum products supplied down from 26 percent in 2014 to 14 percent in 2020 and then up to 17 percent in 2040 as oil production declines from its peak in 2020 in EIA’s Reference case.
 Source: EIA, http://www.eia.gov/pressroom/presentations/sieminski_04142015.pdf
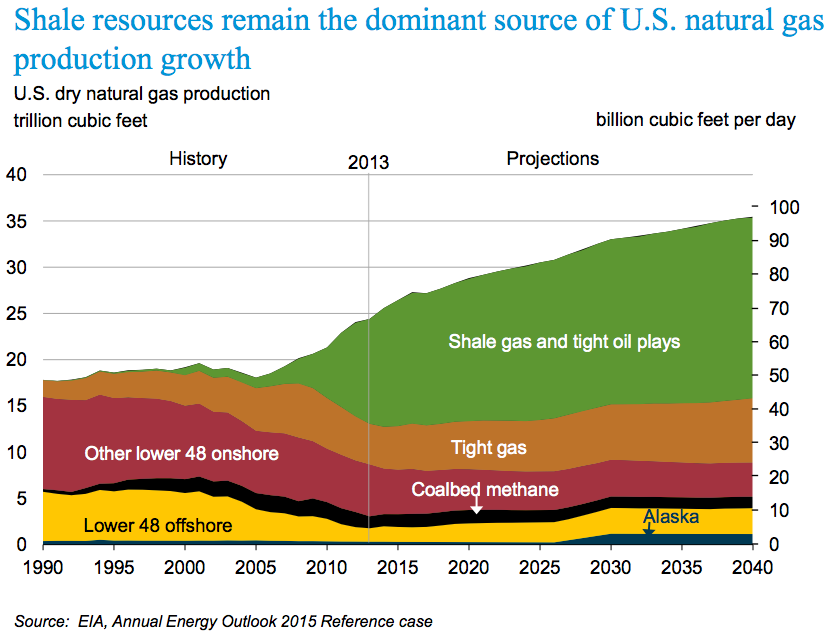
Natural Gas Production
In 2014, dry natural gas accounted for 30 percent of total U.S. energy production and it continues to be the largest contributor to total U.S. energy production through 2040. Dry natural gas production has increased rapidly in recent years. From 2008 to 2014, dry natural gas production increased from 20.2 trillion cubic feet to 25.7 trillion cubic feet and its continued growth is expected in AEO 2015, reaching 35.45 trillion cubic feet in 2040. The strongest growth in natural gas production occurs in the Marcellus Shale and Utica Shale formations in the east, followed by the Gulf Coast, and the Dakotas/Rocky Mountains region.
Source: EIA, http://www.eia.gov/pressroom/presentations/sieminski_04142015.pdf
EIA expects the Henry Hub natural gas spot price (in 2013 dollars) to increase from $3.69 per million British thermal units (Btu) in 2015 to $4.88 per million Btu in 2020 and to $7.85 per million Btu in 2040, as increased demand in domestic and international markets leads to the production of increasingly expensive resources. U.S. natural gas prices are determined primarily by the availability and cost of domestic natural gas resources.
In the AEO 2015, the United States transitions from a net importer of 1.2 trillion cubic feet of natural gas in 2014 to a net exporter in 2017. Net exports continue to grow after 2017, reaching 5.6 trillion cubic feet in 2040. LNG exports reach 3.3 trillion cubic feet in 2030 and remain at that level through 2040, accounting for over 50 percent of total U.S. natural gas exports. The growth in U.S. LNG exports is supported by differences between international and domestic natural gas prices. LNG supplied to international markets is primarily priced on the basis of world oil prices, which results in significantly higher prices for global LNG than for domestic natural gas. However, the relationship between the price of international natural gas supplies and world oil prices is assumed to weaken later in the projection period, in part as a result of growth in U.S. LNG export capacity.
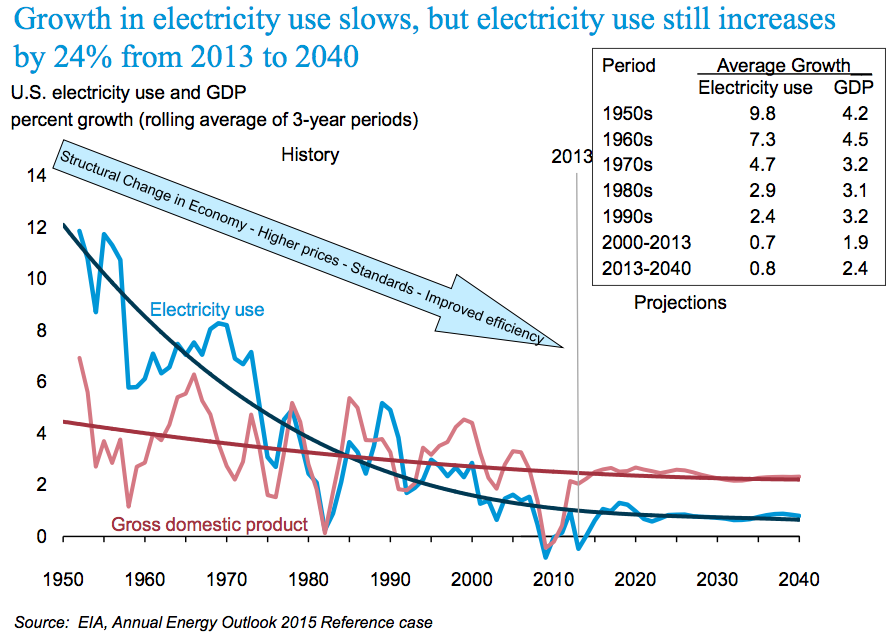
Electricity Generation
At one time, it was believed that electricity demand grew at the same rate as GDP, particularly due to new appliances and uses for electricity such as personal computers and cell phones. However, due to slower population growth, market saturation of electricity-intensive appliances, improvements in the efficiency of household appliances, and a shift in the economy toward a larger share of consumption in less energy-intensive industries, electricity demand is now growing much slower than GDP. EIA expects it it to grow at an average annual rate of 0.8 percent between 2013 and 2040, or one-third of the growth rate expected for GDP. But even at that growth rate, electricity use is expected to increase by 24 percent between 2013 ans 2040.
 Source: EIA, http://www.eia.gov/pressroom/presentations/sieminski_04142015.pdf
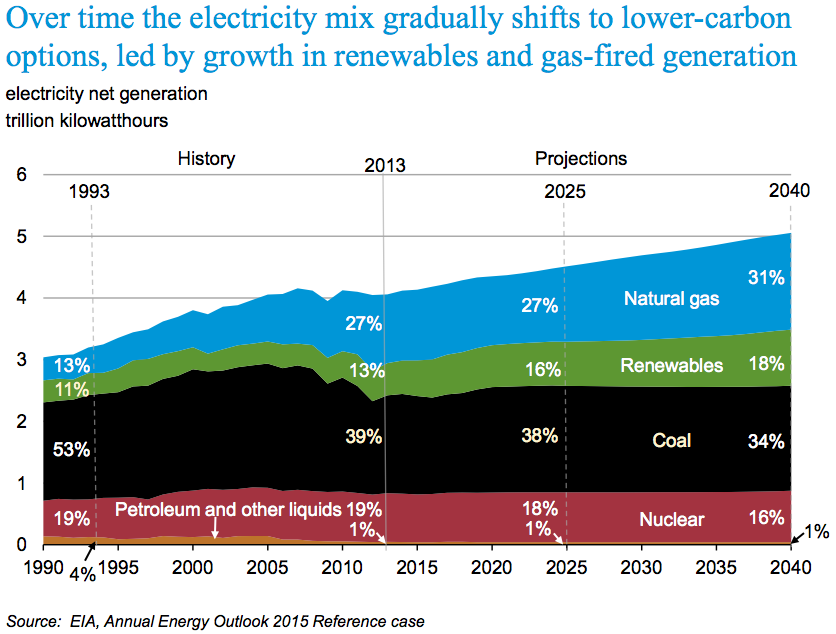
Coal remains the largest generator of electricity in AEO 2015, but its share drops from 39 percent in 2014 to 34 percent in 2040 due to onerous regulations that are already in place forcing existing capacity to retire. Some of the slack is taken over by natural gas, which increases its share of total electricity generation from 27 percent in 2014 to 31 percent in 2040. Nuclear generation reduces its share from 19 percent to 16 percent as nuclear reactors retire due to onerous regulations and the inability to compete as merchant plants with natural gas in some U.S. areas. Renewable energy increases its share of total generation from 13 percent in 2014 to 18 percent in 2040. Federal tax credits and state renewable portfolio standards drive the growth of non-hydropower renewable sources until 2018, when the growth of renewable generation moderates due to the expiration of several key federal and state policies, competition from relatively low natural gas prices, and the relatively slow growth of electricity demand. After 2030, renewable generation growth again increases due to increasing natural gas prices.
Wind and solar generation account for nearly two-thirds of the increase in total renewable generation in the AEO2015. Solar photovoltaic (PV) technology is the fastest-growing energy source for renewable generation, at an annual average rate of 6.8 percent. Wind energy accounts for the largest absolute increase in renewable generation, becoming the largest source of renewable generation by 2040, displacing hydroelectric power. PV capacity accounts for nearly all the growth in solar generation, split between the electric power sector and customer-sited generation in the end-use sectors. Geothermal generation grows at an average annual rate of about 5.5 percent, but because geothermal resources are concentrated geographically, growth is limited to the western United States. Biomass generation increases by an average of 3.1 percent per year, led by co-firing at existing coal plants through 2030, after which new dedicated biomass plants account for most of the growth in biomass generation.
Source: EIA, http://www.eia.gov/pressroom/presentations/sieminski_04142015.pdf
In the AEO2015, increasing costs of electric power generation and transmission and distribution result in an 18 percent increase in the average retail price of electricity. Average electricity prices increase from 10.1 cents per kilowatthour in 2013 to 11.8 cents per kilowatthour in 2040 (in 2013 dollars). There has been a fivefold increase in investment in new electricity transmission capacity in the United States since 1997, as well as large increases in spending for distribution capacity. Although investments in new transmission and distribution capacity do not continue at the same rates in AEO2015, spending continues on additional transmission and distribution capacity to connect to new renewable energy sources; improvements in the reliability and resiliency of the grid; enhancements to community aesthetics (underground lines); and smart grid construction.
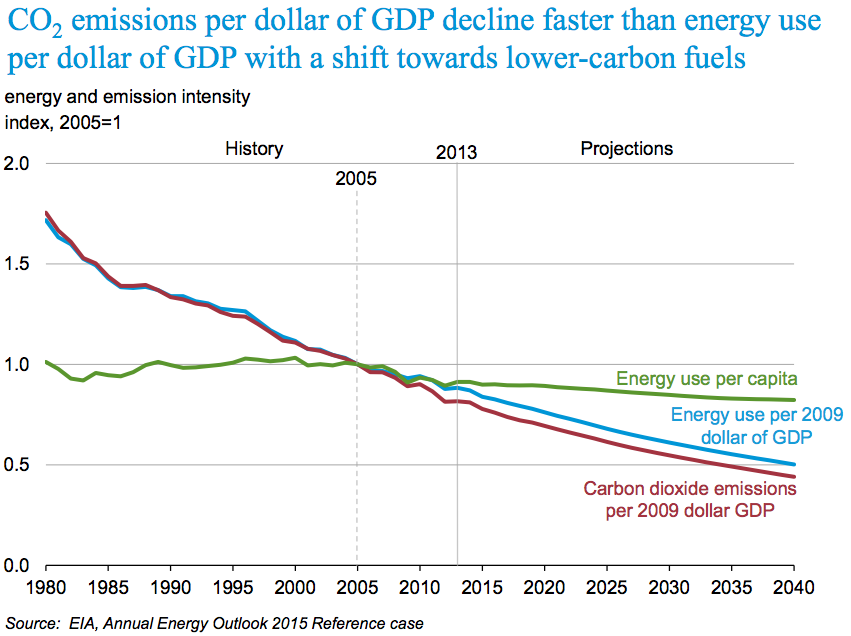
Carbon Dioxide Emissions
Improved efficiency in the end-use sectors and a shift away from more carbon-intensive fuels help to stabilize U.S. energy related carbon dioxide (CO2) emissions, which remain below the 2005 level through 2040. Energy-related carbon dioxide (CO2) emissions in 2013 totaled 5,405 million metric tons. In AEO2015, CO2 emissions increase by 144 million metric tons (2.7 percent) from 2013 to 2040, to 5,549 million metric tons, which are 444 million metric tons below the 2005 level of 5,993 million metric tons.
 Source: EIA, http://www.eia.gov/pressroom/presentations/sieminski_04142015.pdf
Conclusion
Despite the Obama Administration spending billions of dollars to support the renewable industry in the United States, fossil fuels are still expected to supply 80 percent of America’s energy needs in 2040. Renewable energy only gains 2 percentage points by 2040 from today share of less than 10 percent. As EIA’s forecast shows, when Federal and state incentives for renewable energy are removed, renewable energy has a tough time competing against low-cost natural gas. Only when natural gas prices escalate after 2030, does renewable energy grow in the marketplace.
It is important to note that EIA did not incorporate EPA’s plan for existing power plants in this forecast. As a result, coal still remains the dominant generator in the electric power sector. Despite that assumption, average electricity prices increase by 18 percent in the forecast. EPA’s plan for existing power plants would increase that percentage significantly since the retiring coal plants would need to be replaced by much higher cost generators. Existing electricity generation – regardless of type – are the most economical producers of electricity. If the government forces wholesale replacement of existing units, prices will skyrocket.
[1] For a definition of the High Oil and Gas Resource Case, see http://www.eia.gov/forecasts/aeo/chapter_intro.cfm
[i] Energy Information Administration, Annual Energy Outlook 2015, April 14, 2015, http://www.eia.gov/forecasts/aeo/pdf/0383(2015).pdf
