
The Energy Information Administration’s (EIA) Annual Energy Outlook (AEO) 2016 shows a sizable increase in generation from natural gas, wind, and solar in both its major cases—i.e., with and without EPA’s so-called “Clean Power Plan (CPP)”. After comparing the levelized costs of competing generating technologies that EIA publishes,[i] that forecast is no surprise. Levelized costs represent the cost of building and operating a generating plant over an assumed financial life and duty cycle. The levelized costs for these renewable and gas technologies are much lower in this year’s Annual Energy Outlook than in last year’s Outlook.[ii] Generally, the levelized costs for the natural gas technologies are 20 to 25 percent less than last year’s costs; the levelized costs for wind are about 25 percent less; and the levelized costs for solar PV are over 40 percent less. The reasons for the lower costs vary from lower capital cost assumptions to larger tax credits for the renewable technologies and lower fuel prices for the natural gas generators.
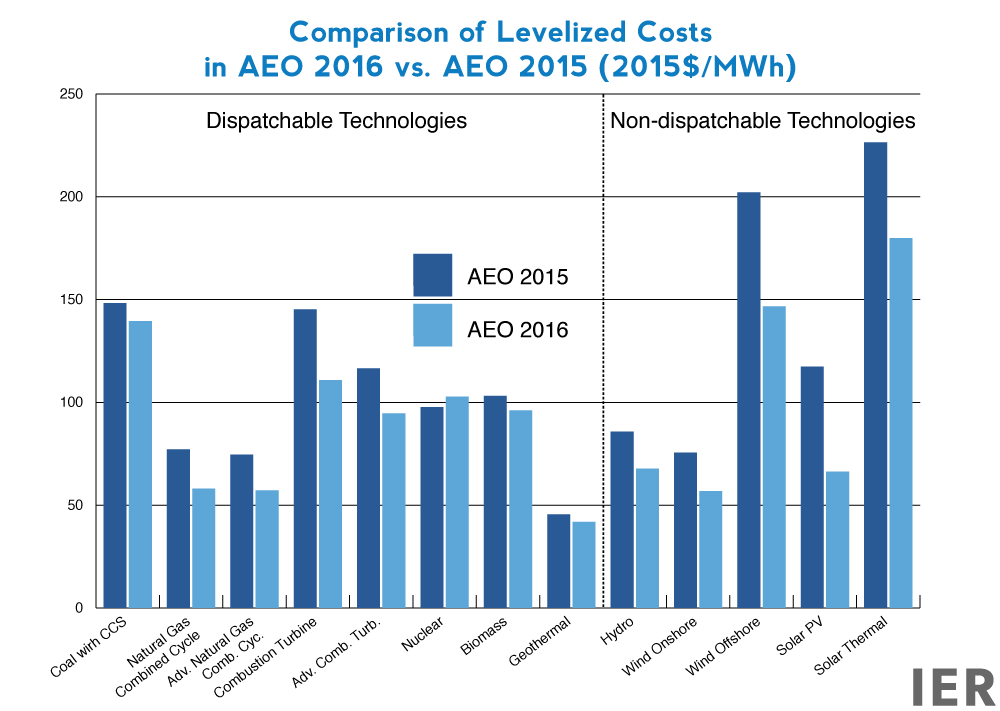
Sources: EIA, http://www.eia.gov/forecasts/archive/aeo15/pdf/electricity_generation_2015.pdf and http://www.eia.gov/forecasts/aeo/pdf/electricity_generation.pdf
Note: Levelized costs are compared for plants entering service in 2020 for AEO 2015 and plants entering service in 2022 for AEO 2016.
Capital Cost Assumptions
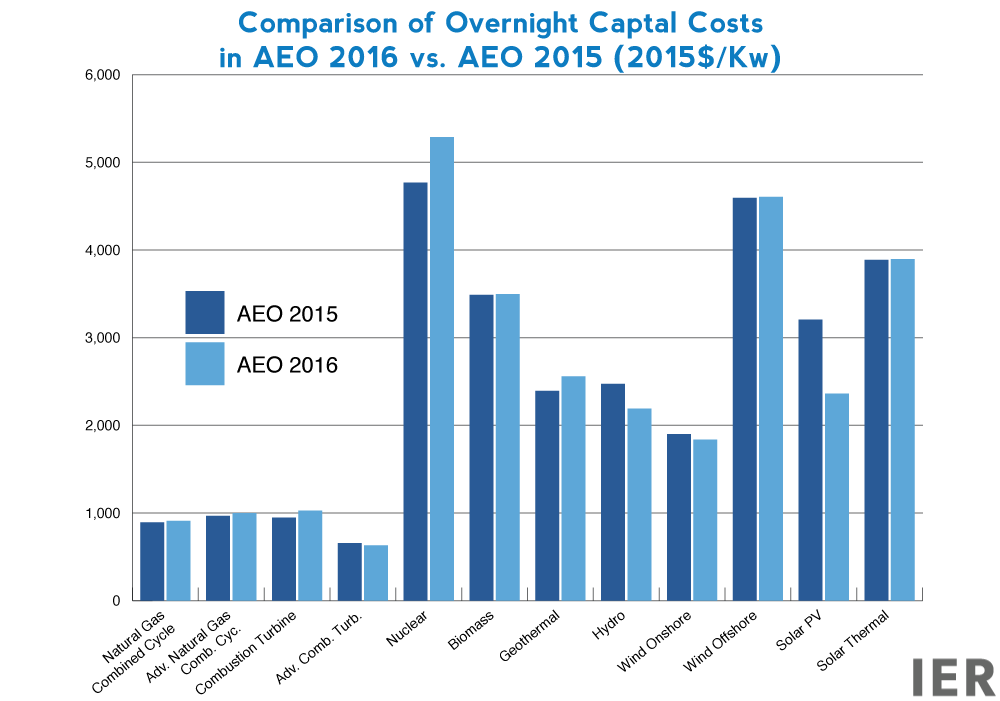
EIA’s capital costs assumptions for Annual Energy Outlook 2016 show large reductions for hydropower and solar PV generators compared to those used in last year’s report. Capital costs for hydropower generators are about 12 percent lower; and for solar PV, they are about 24 percent lower.[iii] The capital costs are shown in the graph below. These capital costs represent a typical facility and are overnight costs, which exclude interest accrued during plant construction and development. EIA uses regional cost adjustment factors to represent regional differences in labor and construction costs. Variability in cost is also based on project size, location, and access to key infrastructure (such as grid interconnections, fuel supply, and transportation).
For wind, EIA states “the cost favorability of the lowest‐cost regions compound the underlying variability in regional cost and create a significant differential between the unadjusted costs and the capacity‐ weighted average national costs as observed from recent market experience.” To correct for this, the average capital cost that EIA provides for wind in AEO 2016 is “a weighted average cost… based on the regional cost factors assumed for wind in the AEO2016 and the actual regional distribution of wind builds that occurred in 2014.” However, for comparison purposes with AEO 2015, we use $1837 per kilowatt for the capital cost of onshore wind as noted in EIA’s footnote 10 to Table 8.2.
Sources: EIA, http://www.eia.gov/forecasts/aeo/assumptions/pdf/electricity.pdf and http://www.eia.gov/forecasts/aeo/assumptions/pdf/table_8.2.pdf
Tax Credits for Renewable Technologies
Between AEO 2015 and AEO 2016, the Congress passed and the President signed into law an omnibus spending bill that gave a five-year extension of renewable energy tax credits for wind and solar. The bill extends the Investment Tax Credit (ITC) for solar, which was originally expected to sunset at the end of 2016, until 2021. The 30-percent ITC will be extended until December 31, 2019. Projects that start construction in 2020 and 2021 will receive 26 percent and 22 percent, respectively. To obtain these ITC rates, all projects must be completed by 2024.[iv] After that, the ITC for solar will revert to its permanent 10 percent rate.
The Production Tax Credit (PTC) for wind developers is a credit of $0.023 per kilowatt hour for wind generation. The legislation retroactively extended the PTC for 2015 and will maintain that level through 2016, at which point it will start phasing down at 80 percent of its present value in 2017, 60 percent in 2018 and 40 percent in 2019. It expires in 2020. The legislation allows wind projects to qualify as long as they start construction before the end of the period.[v]
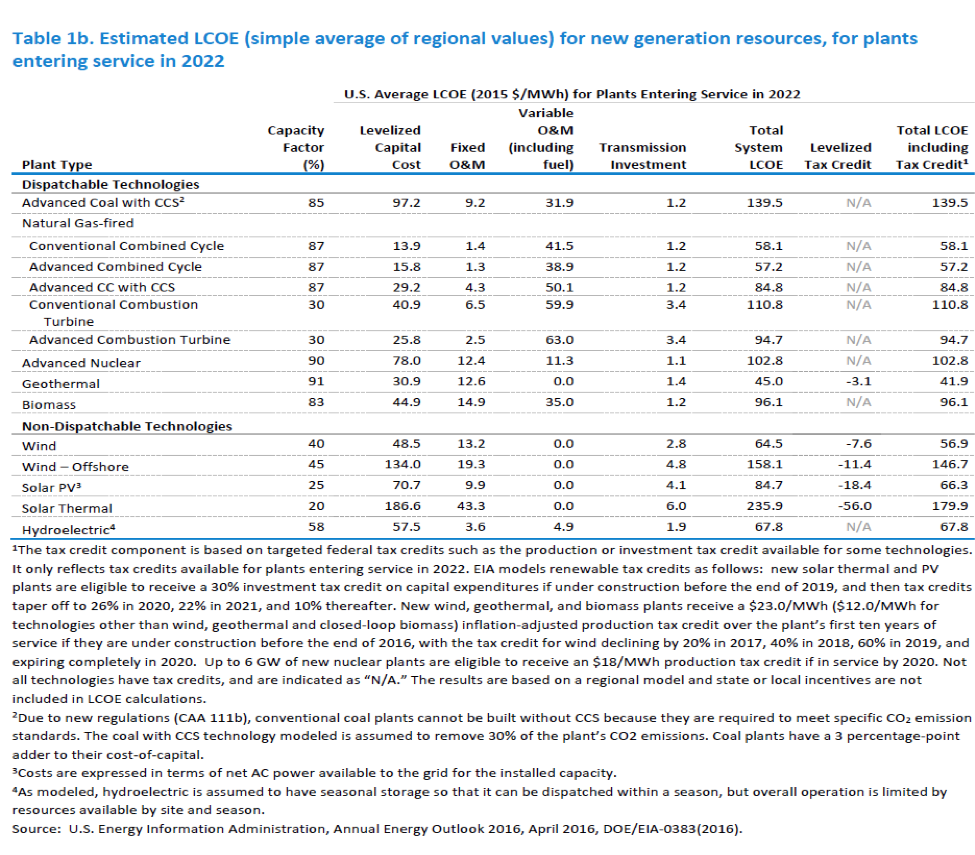
These tax credit extensions result in very favorable levelized costs for wind and solar PV as the table below shows. With the tax credit, the levelized costs for wind is $56.9 per megawatt hour and for solar PV is $66.3 per megawatt hour for plants entering service in 2022, compared to $57.2 per megawatt hour for an advanced natural gas combined cycle unit.
Source: EIA, http://www.eia.gov/forecasts/aeo/pdf/electricity_generation.pdf
The values shown in the above table are calculated based on a 30-year cost recovery period, using a real after tax weighted average cost of capital of 5.6 percent. (In AEO 2015, it was 6.1 percent; the lower rate in AEO 2016 reduces the levelized capital cost component.) As in the past, EIA adds a 3-percentage-point increase in the cost of capital when evaluating investments in new coal-fired power plants, new coal-to-liquids plants without carbon capture and storage (CCS), and pollution control retrofits to represent the financial risk associated with major investments in facilities with a relatively higher rate of carbon dioxide emissions. EIA states, “Although any new coal-fired plants are assumed to be compliant with the new source performance standard for carbon emissions under Section 111(b) of the Clean Air Act, these plants only capture 30% of CO2 emissions and would still be considered high emitters relative to other new sources and thus may continue to face potential financial risk if carbon emission controls are further strengthened.” Thus, the levelized costs for coal plants in EIA’s forecast are higher than they would be if the same cost of capital was used for all technologies.
The levelized cost for each technology is evaluated based on the capacity factor indicated in the above table, which generally corresponds to the high end of its likely utilization range. The capacity factors shown for solar, wind, and hydroelectric resources are averages of the capacity factor for the marginal site in each region. EIA increased the average capacity factors in this year’s AEO for wind and hydropower technologies, which is another factor in their lower levelized cost estimates. The capacity factor for onshore wind was increased from 36 percent in last year’s AEO to 40 percent in this year’s AEO. The average capacity factor for offshore wind was increased from 38 percent to 45 percent; the average capacity factor for hydroelectric power was increased from 54 percent to 58 percent.
Because the duty cycle for intermittent renewable resources, wind and solar, is not operator controlled, but dependent on the wind and sun, they will not necessarily correspond to operator dispatched duty cycles. As a result, their levelized costs are not directly comparable to those for other technologies and are shown separately in the table.
EIA also provides a range of levelized costs based on the 22 regions that the agency models. The table below contains the regional ranges as well as the capacity weighted levelized cost based on the capacity that is projected to come on line in 2022.
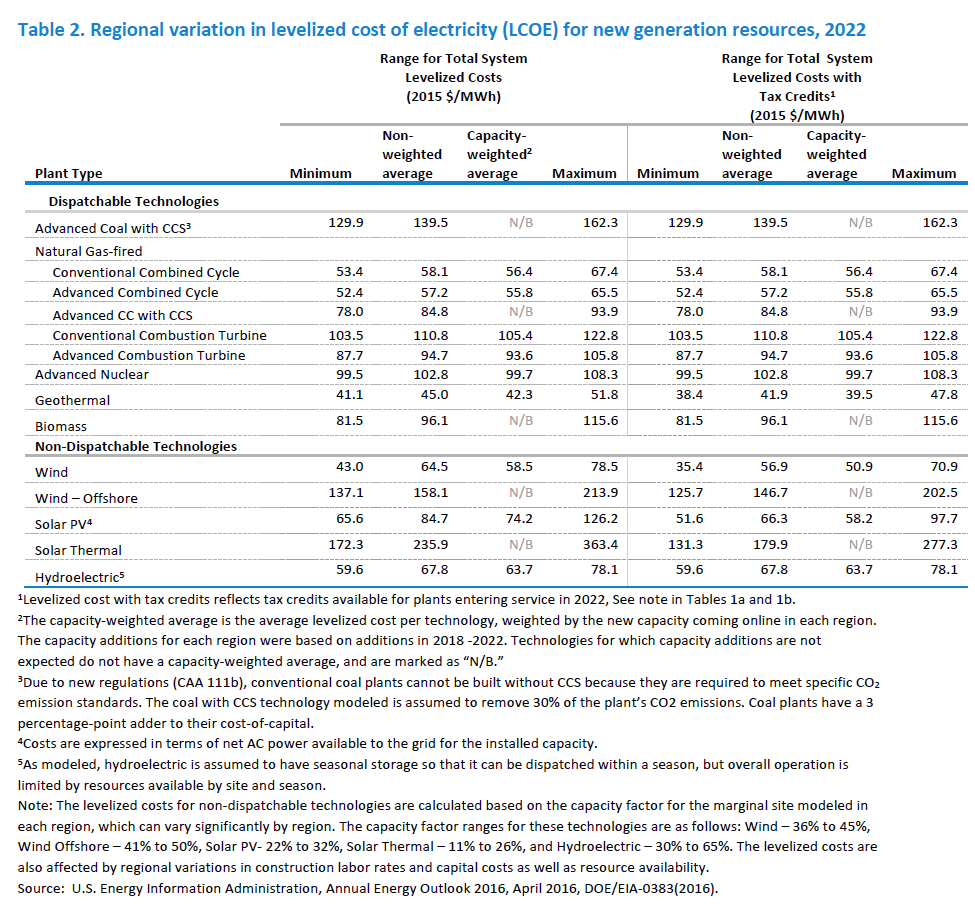
Source: EIA, http://www.eia.gov/forecasts/aeo/pdf/electricity_generation.pdf
Natural Gas Fuel Prices
The levelized costs for natural gas generating technologies was also much lower in AEO 2016 than in last year’s AEO despite the capital costs being about the same. The major difference was in the variable operations and maintenance component which was reduced by 30 percent for the combined cycle gas units. One explanation is that natural gas prices delivered to electric utilities was less in this year’s AEO compared to last year’s AEO. In 2022, they are over $1 per thousand cubic feet less. (See graph below.)
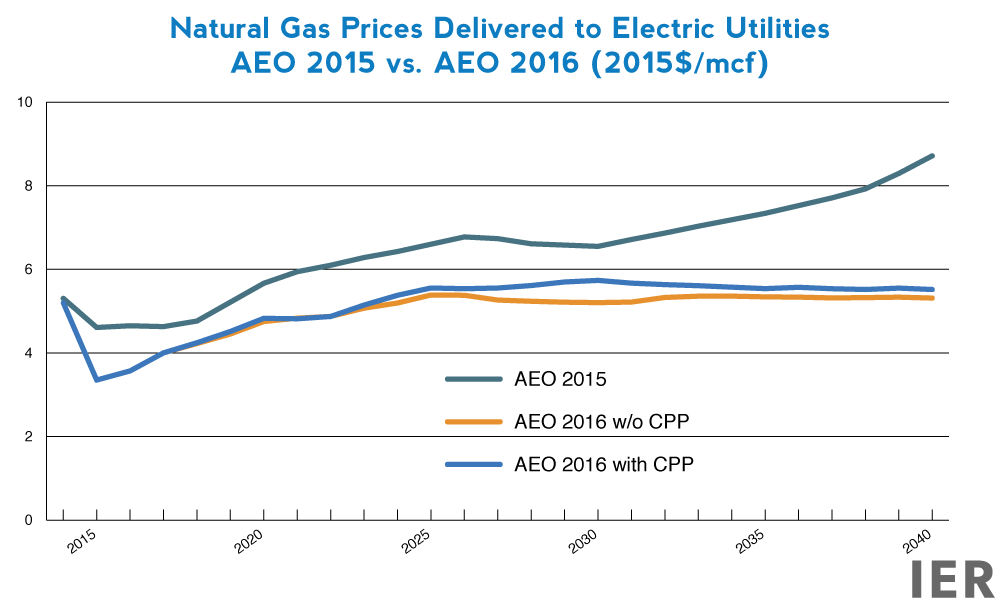
Source: EIA, AEO 2015 and AEO 2016 forecasts
Electric Utility Sector Generation Shares
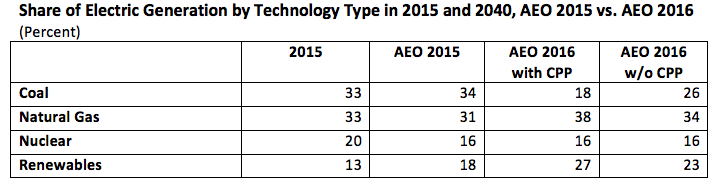
AEO 2016 has substantially less coal generation than in AEO 2015—an 18 percent share in 2040 in the case with the Clean Power Plan compared to 34 percent in last year’s AEO and 33 percent in 2015. Natural gas increases its share from 33 percent in 2015 to 38 percent in 2040 when the Clean Power Plan assumptions are included. Renewable generation increases from 13 percent today to 27 percent in 2040—a doubling—due to the Clean Power Plan and the EIA assumptions regarding capacity factors and capital costs as well as the extension of the tax credits for solar, wind, and other renewable technologies.
Conclusion
Assumptions drive the result and that statement is clearly reflected in this year’s AEO, which shows a strong increase in renewable energy generation, particularly when EPA’s Clean Power Plan is included in the forecast. But, even without incorporation of the Clean Power Plan, renewable energy garners a 10-percentage point increase in generation by 2040 due mainly to the lower capital cost assumptions and the extension of tax credits for renewable technologies.
[i] Energy Information Administration, Levelized Cost and Levelized Avoided Cost of New Generation Resources in the Annual Energy Outlook 2016, August 2016, http://www.eia.gov/forecasts/aeo/pdf/electricity_generation.pdf
[ii] Energy Information Administration, Levelized Cost and Levelized Avoided Cost of New Generation Resources in the Annual Energy Outlook 2015, June 2015, http://www.eia.gov/forecasts/archive/aeo15/pdf/electricity_generation_2015.pdf
[iii] Energy Information Administration, Electricity Market Module, September 2015, http://www.eia.gov/forecasts/aeo/assumptions/pdf/electricity.pdf and Cost and Performance Characteristics of New Generating Technologies, Annual Energy Outlook 2016, June 2016, http://www.eia.gov/forecasts/aeo/assumptions/pdf/table_8.2.pdf
[iv] Renewable Energy World, Making Sense of the Tax Credit Extensions for Wind, Solar, December 16, 2015, http://www.renewableenergyworld.com/articles/2015/12/making-sense-of-the-itc-extension-for-wind-solar-and-bioenergy-too.html
[v] Wind Power, Congress Passes Omnibus Bill with Five-Year Wind PTC Extension, December 18, 2015, http://nawindpower.com/congress-passes-omnibus-bill-with-five-year-wind-ptc-extension
