
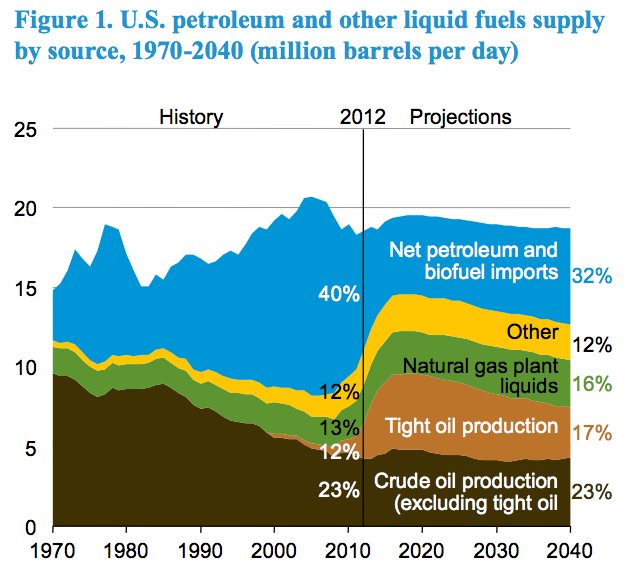
According to the Energy Information Administration, the shale oil boom will account for over 80 percent of the growth in U.S. oil production through 2020 and could effectively eliminate imports of foreign crude if production remains strong.[i] EIA expects U.S. oil production in 2020 to tie the record for the highest domestic oil production ever at 9.6 million barrels a day previously set in 1970. Increasing to 9.6 million barrels a day is almost 50 percent higher than the 6.5 million barrels per day produced in 2012. At those levels, shale oil production will account for about half of the nation’s oil output. Further, if the industry can become more productive and develop more resources, the U.S. can eliminate crude imports altogether. To achieve this, improved production techniques, higher well productivity rates, and more resource development in Alaska and offshore are needed, but the latter requires more cooperation from the Federal government than has been the case under the Obama Administration.
The Annual Energy Outlook 2014 Oil Resource Scenarios
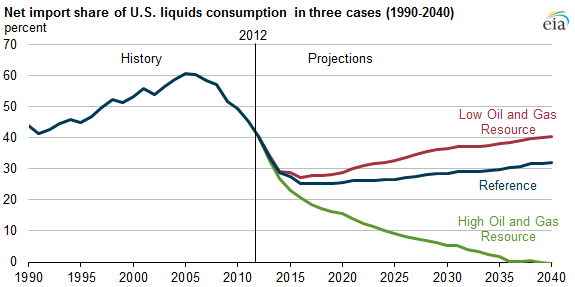
In its reference case, EIA projects that oil imports will represent about 25 percent of U.S. consumption later this decade. But also in that case, oil output declines to less than 8 million barrels a day and imports rise again to 32 percent by 2040. (See chart below.)
 Source: Annual Energy Outlook 2014, http://www.eia.gov/forecasts/aeo/er/early_production.cfm
Under EIA’s more optimistic High Oil and Gas Resource case, oil imports would no longer be needed after 2035. In that scenario, shale oil (tight oil) would achieve a much bigger share of U.S. production– about 66 percent– and total U.S. crude oil production would reach 11.3 million barrels per day in 2019 and 13.3 million barrels per day in the mid-2030s.That level of production would only happen, however, if more oil resources are discovered and those fields are about 50 percent more productive than under EIA’s reference case assumptions.
Source: Energy Information Administration, http://www.eia.gov/todayinenergy/detail.cfm?id=15731
To achieve energy independence of oil imports, the United States needs to have more resource potential available for drilling and oil companies need to continue to improve technology. The U.S. government could enable this to happen by providing more lease sales, making more acres available for lease, and improving the permitting process, making it less cumbersome and more akin to that of the individual states, where a permit is processed in no more than a month, and in some states, no more than a week.
While the EIA expects production technology to improve and believes that there is more upside potential for larger gains in production than downside potential, it cautions that its long-term projections have a high degree of uncertainty.
Impact on Oil Prices
According to EIA, increased U.S. oil production lowers oil prices on the international market. In the High Oil and Gas Resource case, North Sea Brent crude oil prices are 11 percent lower than in the reference case: $125 per barrel (2012 dollars) in 2040, compared with $141 per barrel in the EIA reference case. But, lower oil prices results in lower motor gasoline and diesel prices, which in turn encourages more consumption than in the reference case.[ii]
In the Low Oil and Gas Resource case, lower levels of domestic crude oil production result in a slightly higher Brent crude oil price than in the reference case—$145 per barrel (2012 dollars) in 2040—just $4 per barrel higher. Because the uncertainty around production increases is greater than the uncertainty around production decreases, assumptions in the Low Oil and Gas Resource case are closer to the assumptions in the reference case than are the assumptions in the High Oil and Gas Resource case.
Optimism around Shale Oil Production
EIA uses production decline curves and the associated estimated ultimate recovery factors for individual wells, which vary widely across plays, within single plays, and even within discrete sections of a single play, to estimate production from each shale formation. In developing the data for each of the shale plays, EIA extrapolates using data from known wells. As more data become available, the estimated ultimate recovery factors change. Using the latest data and updating the assumptions for the Eagle Ford shale formation, for example, EIA’s reference forecast for oil production in the Eagle Ford for this year’s Outlook shows more production and much higher production sooner than the forecast from the previous EIA Outlook. (See graph below.)
 Source: Energy Information Administration, http://www.eia.gov/forecasts/aeo/section_issues.cfm#tight_oil
Obama Administration Performance Statistics
In early April, the Bureau of Land Management (BLM) released new data showing that federal onshore oil and natural gas leases and drilling permits are at the lowest levels in more than a decade.[iii] Specifically,
- Leases to companies exploring the potential of oil and natural gas reserves were down by 0.6 million acres in fiscal year 2013 from 1.8 million acres in fiscal year 2012 to 1.2 million acres in fiscal year 2013–the smallest area since records began to be maintained in 1988.
- The average number of onshore leases that the Bureau of Land Management issued during the Obama Administration is more than 50 percent less than the average number issued by the Clinton Administration and over a third less than those issued by the George W. Bush Administration. In fiscal year 2013, 2,278 fewer leases were issued compared to fiscal year 2006 (1,468 leases in FY 2013 compared to 3,746 in FY 2006).
- The number of drilling permits approved in fiscal year 2013 was the lowest since fiscal year 2002.
- The average time to process a federal drilling permit during the Obama Administration (242 days) is 18 percent longer than the average time it took to process a federal drilling permit during the 5 preceding fiscal years (205 days).
As a result, according to a report by the non-partisan Congressional Research Service, oil production on federal lands fell 6 percent between fiscal years 2009 and 2013 while over the same time period, oil production increased by 61 percent on private and state lands.[iv] In fiscal year 2010, 36 percent of our nation’s oil was produced on federal lands, but, by fiscal year 2013, only 23 percent of our nation’s oil was produced on public lands owned by U.S. citizens. As EIA has shown, greater U.S. oil production means lower oil prices on the international market and lower petroleum prices to the consumer. We can produce more oil if more federal lands are available for leasing, and drilling permits are approved on a more timely basis—but that would require a change in Obama Administration policies.
Conclusion
According to the EIA, energy independence from foreign oil suppliers is within our reach. Energy independence from oil imports is a goal that stymied U.S. Presidents since the 1970s when the United States was hit by the OPEC oil embargo. To achieve that goal, the United States needs ingenuity from the oil and gas companies to improve drilling technologies, which past experience has shown to be achievable, and the U.S. government needs to make public lands available for exploration and drilling. That means Obama Administration policies and performance statistics need to change. Those changes will lower prices, increase federal and state revenues, improve the economy, and supply jobs. To IER, it looks like a no brainer.
[i] Energy Information Administration, Tight oil-driven production growth reduces need for U.S. oil imports, April 7, 2014, http://www.eia.gov/todayinenergy/detail.cfm?id=15731
[ii] Energy Information Administration, U.S. tight oil production: Alternative supply projections and an overview of EIA’s analysis of well-level data aggregated to the county level, April 7, 2014, http://www.eia.gov/forecasts/aeo/section_issues.cfm#tight_oil
[iii] Bureau of Land Management, Oil and Gas Statistics, http://www.blm.gov/wo/st/en/prog/energy/oil_and_gas/statistics.html
[iv] Congressional Research Service, U.S. Crude Oil and Natural Gas Production in Federal and Non-Federal Areas, April 10, 2014, http://energycommerce.house.gov/sites/republicans.energycommerce.house.gov/files/20140410CRS-US-crude-oil-natural-gas-production-federal-non-federal-areas.pdf
