
China became the world’s largest energy consumer in 2009, surpassing the United States, which held the title for more than 100 years, according to the International Energy Agency (IEA).[i] The recession took a toll on U.S. industrial output, adding to a decline in total energy consumption that was almost 5 percent below 2008 levels.[ii] The United States leads the world in oil consumption, consuming more than twice China’s level, but China leads the world in coal consumption and hydroelectric capacity, using more than twice the U.S. level of coal and having more than twice the U.S. hydroelectric capacity. Because coal emits twice the level of carbon dioxide as natural gas and because of China’s extensive coal use, it surpassed the United States in carbon dioxide emissions in 2007 and continues to hold that lead.
History and Projections
Just a short seven years ago, China consumed less than half the energy that the United States consumed.[iii] By 2009, China had not only caught up with the United States as far as energy consumption was concerned, but consumed almost 4 percent more energy than the United States, which was suffering from an economic downturn. According to the IEA, China consumed 2,252 million tons of oil equivalent last year, compared to 2,170 million tons of oil equivalent consumed by the United States.[iv] China’s economy and energy demand have grown at breakneck speed as it has become the world’s leading exporter, and it stands poised to overtake the United States in manufacturing output in 2011. [v]
The United States is the largest consumer of energy on a per capita basis, according to the IEA, using about 5 times the amount of energy as China per inhabitant, in part because of the much wider use of personal transportation in the United States. [vi] However, sales of automobiles in China have now outstripped those in the United States.[vii] So that U.S./China per capita ratio is not likely to continue for long.
China recorded its largest oil demand in June of 2010 at 8.98 million barrels per day, 10 percent higher than a year before, and 0.7 percent higher than May 2010, the previous record.[viii] And China is expected to build an additional 1,000 gigawatts of generating capacity, about the total U.S. electric capacity base, in the next fifteen years, according to the IEA. In contrast, growth in U.S. energy demand has been reduced by the recession, efficiency and intensity improvements, and regulations, while supply has been constrained by opposition to all forms of non-renewable energy and its transport.
The Energy Information Administration projects that by 2035, China will have a total of 1,924 gigawatts of electric generating capacity, compared to 1,216 gigawatts for the United States, with an annual growth rate of over 5 times that of the United States. [ix] Over 60 percent of that new generating capacity is projected to be coal-fired. And while there are “clean” coal technologies for removing sulfur dioxide and nitrogen oxide, there is no commercial technology as yet for removing carbon dioxide emissions. Thus, the EIA projects that China’s carbon dioxide emissions will be over twice that of the United States by 2035, with its emissions from coal being 4.5 times as much as those in the United States.[x]
Global Carbon Dioxide Emissions
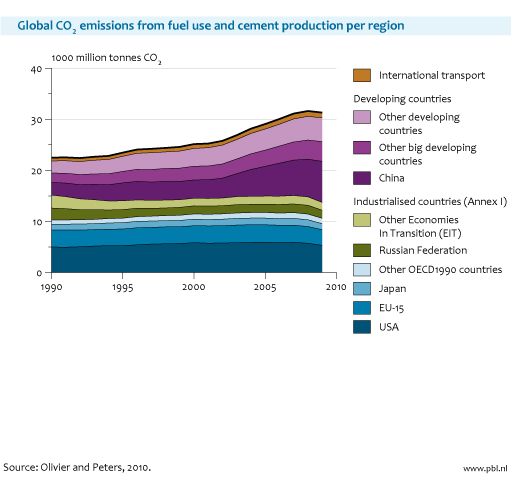
According to the Netherlands Environmental Assessment Agency (PBL)[xi]—using data from British Petroleum (BP), the U.S. Geological Survey (USGS), and the latest version of the Emission Database for Global Atmospheric Research—global carbon dioxide emissions were constant in 2009. (See chart below.) The developed world’s recession brought about reduced fossil fuel consumption, but China and India together offset those reductions.[xii] China increased its coal consumption by 9.6 percent in 2009, and India increased coal consumption by 6.8 percent.[xiii]
According to PBL calculations, emissions from fossil fuel combustion in the industrialized countries (including those from gas flares, the burning of waste gas from oil drilling, and other industrial processes, such as the production of cement and ammonia) decreased by 7 percent owing to an attempted compliance with the Kyoto Protocol by countries that have ratified it and to the global recession. In China, despite a doubling of wind and solar energy for the fifth year in a row, carbon dioxide emissions increased by 9 percent, and in India, they increased by 6 percent.[xiv] Owing to the United Nations’ Clean Development Mechanism (CDM), the developed countries have been funding wind and solar projects in underdeveloped countries as a form of compliance with the Kyoto Protocol.[xv] China has benefited from the CDM to the point that 30 percent of its wind units are still not connected to its electrical grid.[xvi]
China’s Goals for Emission Reductions
China has set targets to reduce energy consumption per unit of economic output by 20 percent this year compared with 2005, and to reduce emissions of greenhouse gases per unit of economic output by 40 to 45 percent in 2020 from its 2005 levels. However, it is finding it difficult to meet these targets owing to its expanding economy and its population’s desires for Western conveniences (e.g., bigger cars, more appliances). As a result, apartment and office buildings are being constructed at a rapid pace; sales of large household appliances (such as refrigerators and washing machines) have more than doubled in the past year in rural China alone, owing to government subsidies to help peasants afford modern conveniences; and Chinese malls, which are exempt from temperature regulations, are being built throughout Chinese cities. To provide the electricity needed, last year, China built new coal-fired power plants with a total capacity greater than all the power plants in New York State.[xvii]
Further, China’s auto sales increased by 48 percent last year, surpassing U.S. auto sales for the first time, and they continue to increase. With its economy shifting away from light industries for export (e.g., toys and clothing) and toward energy intensive industries such as steel and cement to satisfy domestic demand for goods, China has seen its efficiency gains reverse, having declined by 3.2 percent in the first quarter of this year. China uses twice as much energy per dollar of output as the United States and three times as much as the European Union. Further, manufacturing, which is energy intensive, makes up three times as much of the Chinese economy as it does the U.S. economy.[xviii]
With huge demand increases in electricity generation and steel mills, Chinese coal imports are expected to reach a record in 2010. According to Peabody Coal, China imported 70 million metric tons of coal during the first 6 months of this year, double the amount it imported through June of last year.[xix] China uses coal in its industrial processes in addition to its electricity production. In 2007, for example, China produced 50 percent of the world’s cement, more than 13 times as much as the United States.[xx]
Conclusion
As a result of its economic growth—expected to be 10 percent this year—and its citizens’ demand for Western conveniences, China’s energy requirements are increasing and it is becoming less energy efficient, contrary to its stated goals. Because most of its energy is produced from coal, China’s carbon dioxide emissions are increasing at a rapid pace. In fact, China’s carbon dioxide emissions have shown the largest six-month increase ever by a single country.[xxi] With double-digit economic growth, plus growing consumer demand and manufacturing capabilities, China is focused on supplying energy to feed its economic growth and to meet the needs of its population. As Faith Birol, head of the IEA said when announcing China’s new status as the world’s number one energy consumer, China’s ascendancy marks “the start of a new age in the history of energy.”
[i]The Wall Street Journal, China Passes US as the World’s Biggest Energy Consumer IEA, July 19, 2010, http://online.wsj.com/article/SB10001424052748703720504575376712353150310.html?hat_input=China+Passes+U.S.+as+World%27s+Biggest+Energy+Consumer
[ii] Energy Information Administration, Monthly Energy Review, http://www.eia.doe.gov/emeu/mer/pdf/pages/sec2_3.pdf
[iii] Energy Information Administration, http://tonto.eia.doe.gov/cfapps/ipdbproject/iedindex3.cfm?tid=44&pid=44&aid=2&cid=&syid=1999&eyid=2004&unit=QBTU
[iv] According to the BP Statistical Review that includes oil, natural gas, coal, nuclear, and hydroelectric power in its primary energy statistics, China was still slightly behind the U.S. in energy consumption with the U.S. consuming 2,182 million metric tons of oil equivalent, and China consuming 2,177 million metric tons of oil equivalent. See http://www.bp.com/liveassets/bp_internet/globalbp/globalbp_uk_english/reports_and_publications/statistical_energy_review_2008/STAGING/local_assets/2010_downloads/statistical_review_of_world_energy_full_report_2010.pdf
[v] “US manufacturing crown slips”, Financial Times, June 20, 2010 http://www.ft.com/cms/s/0/af2219cc-7c86-11df-8b74-00144feabdc0.html
vi The Wall Street Journal, China Passes US as the World’s Biggest Energy Consumer IEA, July 19, 2010, http://online.wsj.com/article/SB10001424052748703720504575376712353150310.html?hat_input=China+Passes+U.S.+as+World%27s+Biggest+Energy+Consumer
[vii] “China overtakes US as world’s biggest car market” The Guardian, January 8, 2010. http://www.guardian.co.uk/business/2010/jan/08/china-us-car-sales-overtakes
[viii] Platt’s Report: China’s Oil Demand in June Hits New High, Up 10% from Year Ago, July 21, 2010, http://www.prnewswire.com/news-releases/platts-report-chinas-oil-demand-in-june-hits-new-high-up-10-from-year-ago-98919164.html
[ix] Energy Information Administration, International Energy Outlook 2010, http://www.eia.doe.gov/oiaf/ieo/pdf/ieoecg.pdf
[x] Ibid., http://www.eia.doe.gov/oiaf/ieo/pdf/ieorefcase.pdf
[xi] “No growth in total global CO2 emissions in 2009”, Netherlands Environmental Assessment Agency, July 1, 2010, http://www.rivm.nl/bibliotheek/rapporten/500212001.pdf.
[xii] Financial Times, China and India, the CO2 culprits of 2009, July 5, 2010, http://blogs.ft.com/energy-source/2010/07/05/china-and-india-the-co2-culprits-of-2009/
[xiii] BP Statistical Review of World Energy, June 2010, http://www.bp.com/liveassets/bp_internet/globalbp/globalbp_uk_english/reports_and_publications/statistical_energy_review_2008/STAGING/local_assets/2010_downloads/statistical_review_of_world_energy_full_report_2010.pdf
[xiv] “No growth in total global CO2 emissions in 2009”, Netherlands Environmental Assessment Agency, July 1, 2010, http://www.rivm.nl/bibliotheek/rapporten/500212001.pdf.
[xv] Institute for Energy Research, https://www.instituteforenergyresearch.org/2010/03/24/kyotos-clean-development-mechanism-is-it-producing-results-for-whom/
[xvi] Wall Street Journal, China’s Wind Farms Come With a Catch: Coal Plants, September 28, 2009, http://online.wsj.com/article/SB125409730711245037.html
[xvii] New York Times, China Fears Consumer Impact on Global Warming, July 4, 2010, http://www.nytimes.com/2010/07/05/business/global/05warm.html?_r=1
[xviii] Ibid.
[xix] ClimateWire, Coal: Peabody’s 2Q earnings surge on China’s galloping energy demand, July 21, 2010, http://www.eenews.net/climatewire/2010/07/21/3/
[xx] U.S. Geological Survey, http://minerals.usgs.gov/minerals/pubs/commodity/cement/mcs-2008-cemen.pdf
[xxi] New York Times, China’s Energy Use Threatens Goals on Warming, May 6, 2010, http://www.nytimes.com/2010/07/05/business/global/05warm.html?scp=3&sq=China’s%20Energy%20Use%20Threatens%20Goals%20on%20Warming&st=cse
