
The Bureau of Land Management (BLM) announced in April that it is considering raising the royalty rate for oil and natural gas drilled on Federal lands—currently at 12.5 percent of drilling operations’ production value.[i] The Center for American Progress (CAP) recommended that BLM increase the royalty rate for oil and gas drilled on public lands by at least 50 percent and allow regulators to raise the rate further when the price of these fuels is high because they believe U.S. taxpayers “aren’t receiving a fair share from the development of their resources.”[ii] But CAP has it wrong. If CAP wanted to increase returns to taxpayers, instead of promoting increases in the rates, they would promote streamlining permitting and bringing common sense to regulation on federal lands in order to increase natural gas and oil production and dramatically increase revenues to the U.S. treasury.
Oil and gas companies prefer to drill on private and state lands instead of federal lands due to permitting delays and massive amounts of red tape on federal lands. On non-federal lands, massive production increases have made the United States the largest producer of oil and natural gas in the world.
In fact, if the regulatory hurdles to production on federal lands were curtailed and production on federal lands over the past 4 years increased at the same rate as on private and state lands a whopping $24.47 billion would have been paid to the U.S. treasury from the increase in production alone. This is more than four times the revenue that would have been produced if the royalty rate had been increased by 50 percent.
If the federal government managed its lands like private individuals and states do, we would have more energy, jobs and national income, and it would generate an additional $24 billion to help pay down our debt. The difference between oil and gas production on federal versus non-federal lands is night and day.
Regulatory Hurdles
According to BLM, in fiscal year 2014, it took 227 days to process a permit to drill on federal lands[iii] compared to most oil and gas producing states taking less than a month. According to the North Dakota Petroleum Council, it takes a maximum of 14 days to process a permit to drill in North Dakota.[iv] In Texas, it takes just 4 business days to process a standard drilling permit and 2 business days to process an expedited drilling permit.[v] This additional time and red tape on federal lands imposes costs on operators, which means that the time and red tape reduces valuable economic activity and therefore reduces the return to the American people.
Not only is it expensive in terms of time and money to operate on federal lands, but the federal government is offering fewer and fewer leases, demonstrating a lack of commitment to generating a fair return to the taxpayer owners of federal energy assets. For example, the BLM under the Obama Administration so far has leased less than 20 percent of the leases that the BLM under the Reagan Administration had leased.
Unlike federal lands, the oil and gas regulatory environment in states such as Texas and North Dakota—the two largest oil producing states in the nation–has led to dramatic increases in oil production, overall economic activity, and energy security. North Dakota has led the nation in economic growth in recent years. According to the U.S. Bureau of Economic Analysis, the state ranked first in the country for gross domestic product, which increased by 6.3 percent in 2014, compared to 2.2 percent for the nation.[vi] The mining industry, including oil and gas, contributed 2.47 percentage points to the increase. North Dakota’s per capita personal income in 2014 was $54,951—19 percent higher than that of the nation–and the state created nearly 123,000 new jobs since 2004, ranking first in employment growth in the nation.[vii]
The Department of Interior commissioned the consulting firm, IHS CERA, to compare the oil and gas fiscal systems that apply on federally owned offshore and onshore lands with oil and gas fiscal systems adopted by other countries that compete with the United States for investments in the oil and gas upstream industry. The study found that higher royalty rates could lower the competitive advantage for drilling on public lands.[viii]
Oil and Gas Production on Non-Federal vs. Federal Lands
Since 2010, oil and natural gas production has dramatically increased on private and state lands while it fell on federal lands despite oil prices in excess of $100 a barrel for part of that time. According to data from the Department of Interior (Office of Natural Resources Revenue) compiled by the Congressional Research Service,[ix] oil production increased 89 percent from fiscal year 2010 through fiscal year 2014 on non-federal lands while oil production fell 10 percent on federal lands.
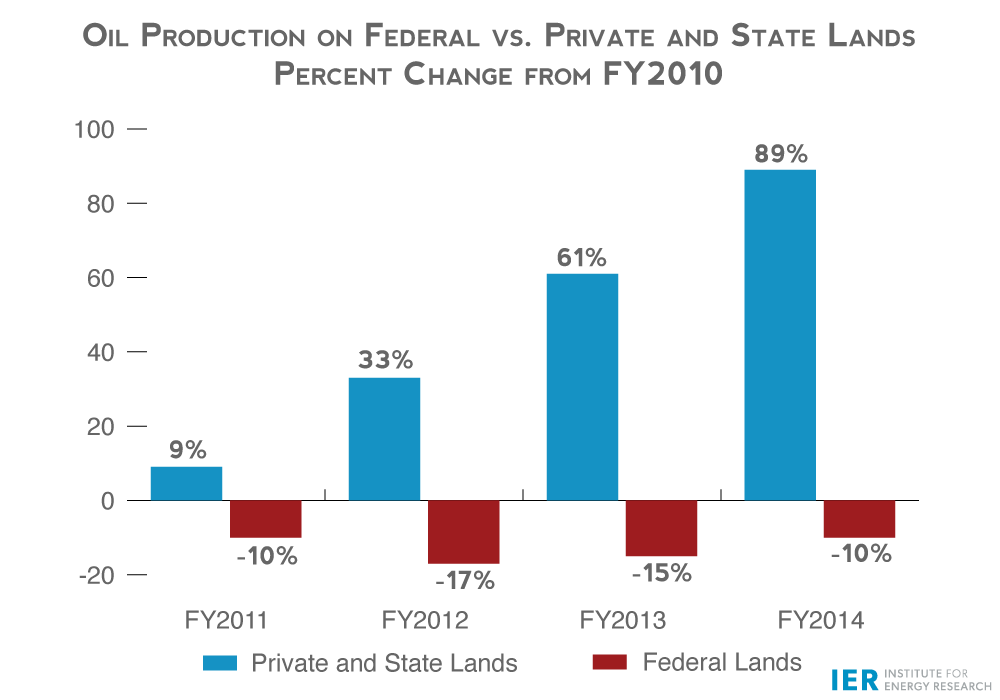
Source: Congressional Research Service, U.S. Crude Oil and Natural Gas Production in Federal and Non-Federal Areas, Apr. 3, 2015, https://www.instituteforenergyresearch.org/wp-content/uploads/2015/04/CRS-federal-vs.-nonfederal.pdf
On private and state lands, natural gas production increased 37 percent while production fell 31 percent on federal lands over that same time period.
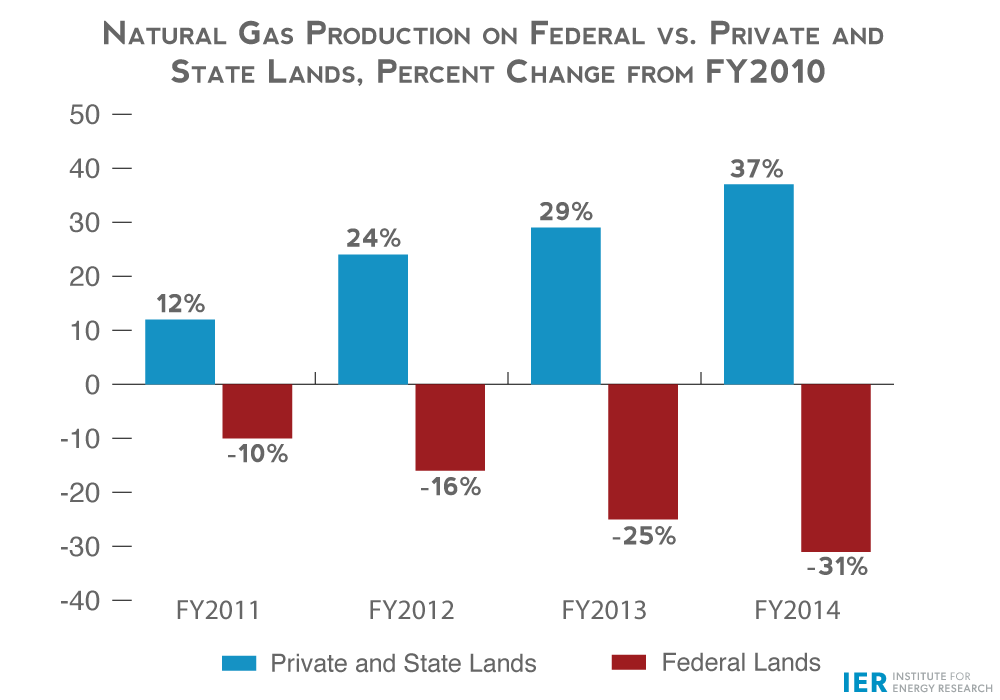
Source: Congressional Research Service, U.S. Crude Oil and Natural Gas Production in Federal and Non-Federal Areas, Apr. 3, 2015, https://www.instituteforenergyresearch.org/wp-content/uploads/2015/04/CRS-federal-vs.-nonfederal.pdf
Oil and natural gas resources on federal lands is vast. For example, the United States contains more than 1.4 trillion barrels of technically recoverable oil[x]—the majority of which is on BLM controlled land.
Additional Royalties from Increasing Production on Federal Lands
Suppose that the U.S. oil and gas industry increased its production of oil and gas on federal lands at the same rate as the industry did on private and state lands over the past 4 years. How much additional revenue from royalties would have been gleaned from the increased production?
According to the Congressional Research Service, oil production on non-federal lands increased between 8.9 percent and 21.9 percent in the years between fiscal year 2010 and fiscal year 2014. (See chart below.) Natural gas production also increased on private and state lands, but at lower rates—between 1.4 and 7.2 percent between fiscal years 2010 and 2014.
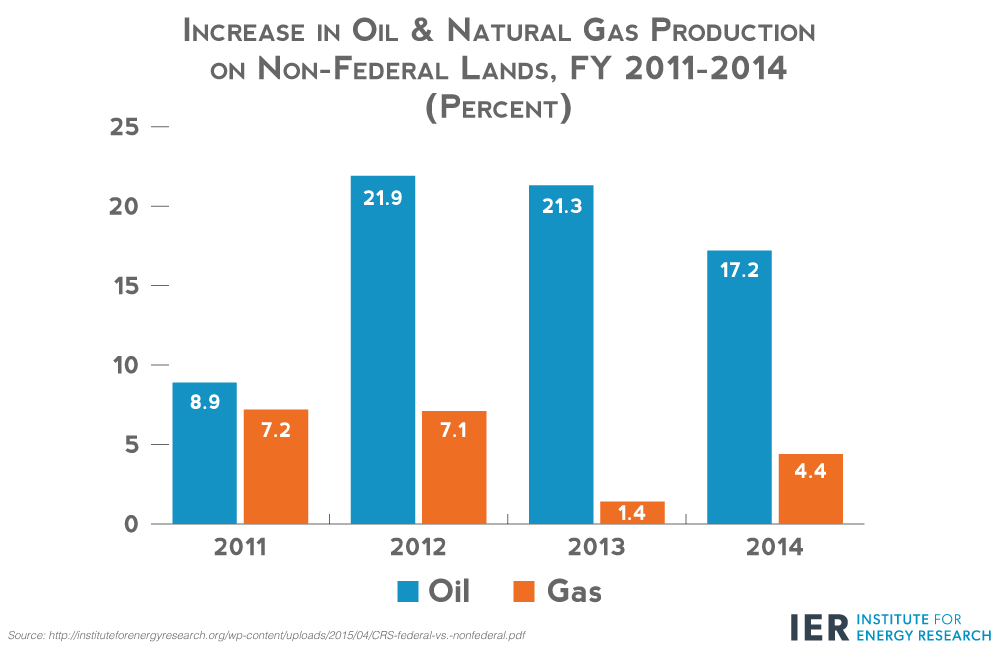
Source: Derived from Congressional Research Service, U.S. Crude Oil and Natural Gas Production in Federal and Non-Federal Areas, Apr. 3, 2015, https://www.instituteforenergyresearch.org/wp-content/uploads/2015/04/CRS-federal-vs.-nonfederal.pdf
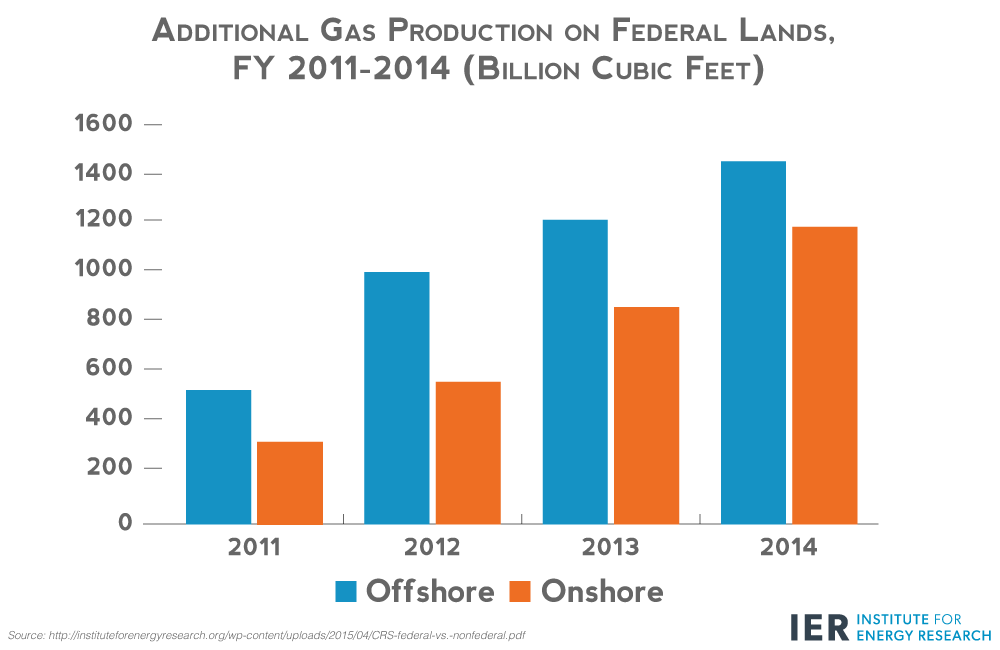
Applying these rates of increase to production of oil and natural on federal lands gives a sizeable increase in production. For example, offshore oil production in fiscal year 2014 would be 1.1 million barrels per day higher[1] and onshore oil production in fiscal 2014 would be over 150,000 barrels per day higher. For natural gas, offshore production in fiscal year 2014 would be 1,459 billion cubic feet higher and onshore production would be 1,195 billion cubic feet higher.
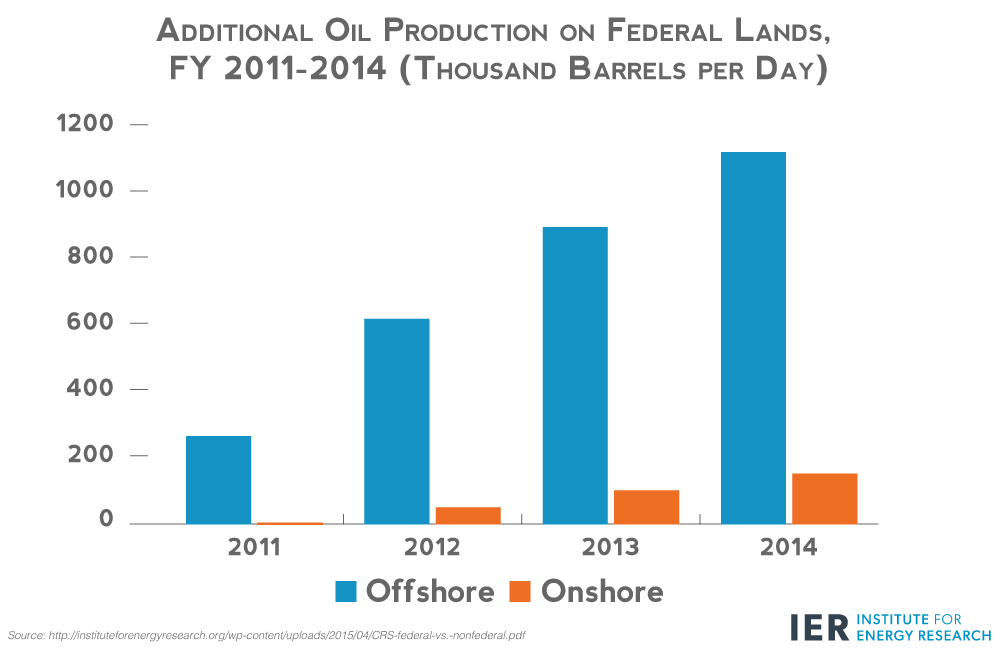
Source: Derived from Office of Natural Resources Revenue, Statistical Information, http://statistics.onrr.gov/ReportTool.aspx
Source: Derived from Congressional Research Service, U.S. Crude Oil and Natural Gas Production in Federal and Non-Federal Areas, Apr. 3, 2015, https://www.instituteforenergyresearch.org/wp-content/uploads/2015/04/CRS-federal-vs.-nonfederal.pdf
Using data from the Energy Information Administration for the domestic first purchase price for oil and the average spot Henry Hub price for natural gas and applying these prices to the additional oil and gas production, we obtained the annual revenues from the increased production.[xi] Applying the offshore royalty rate of 18.75 percent and the onshore royalty rate of 12.5 percent to these revenues gets an additional $24.47 billion in royalty revenue that the American public can receive from the oil and gas on federal lands. (See graphs below.)
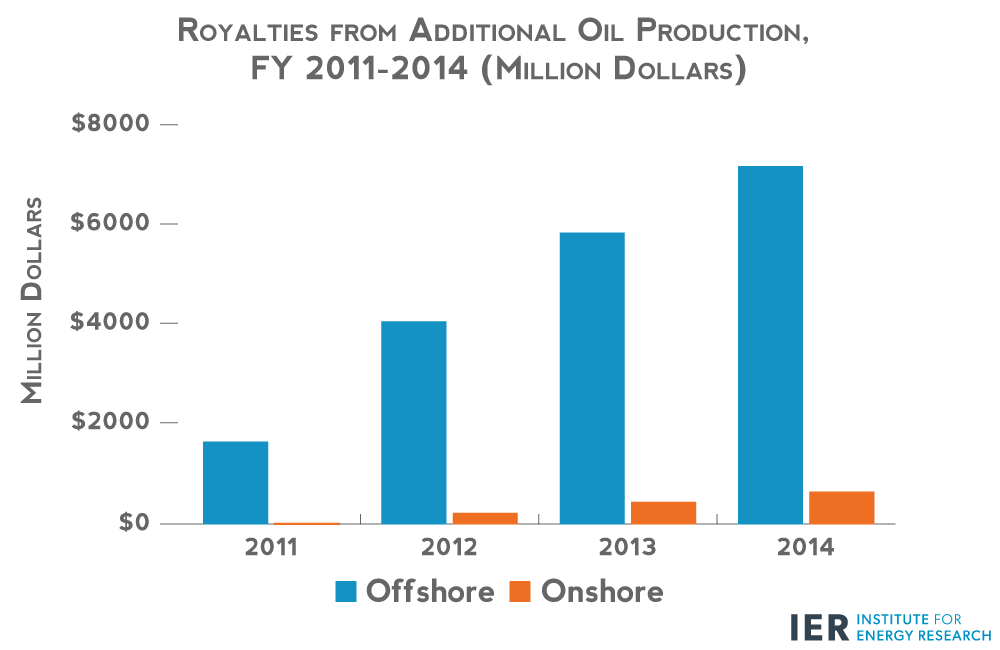
Source: Derived from previous charts and Energy Information Administration, Domestic First Purchase Price, http://www.eia.gov/dnav/pet/pet_pri_dfp1_k_m.htm
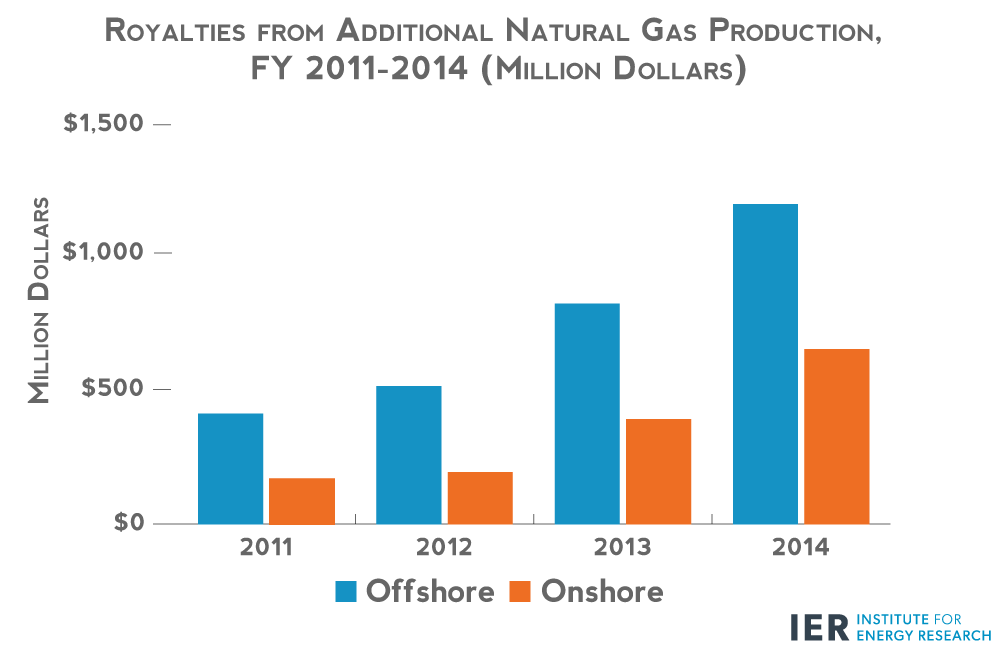
Source: Derived from previous charts and Energy Information Administration, Henry Hub Spot Price, http://www.eia.gov/dnav/ng/ng_pri_fut_s1_m.htm
Conclusion
Rather than making it easier for businesses to hire people, invest and put to use the wealth that we own in America, liberal think tanks and certain policy makers would rather tax those industries more. This is a recipe for less natural gas and oil production. States have regulated those industries for over a century with great success. For some reason the federal government feels that they can do a better job, but permitting and leasing statistics show otherwise.
In the case of oil, production is up 89 percent on non-federal lands, and down 10 percent on federal lands over the past five fiscal years. One must be blind to not see that the federal government’s management of our energy resources is woefully inadequate, cumbersome and expensive. That is why businesses shun federal lands and have invested heavily on non-federal lands. The American public can see far more revenues by allowing access to the nation’s resources with significantly less red tape than if the oil and gas industry were forced to pay higher royalty rates.
[1] Only revenue volumes for offshore oil production were used in the calculation. Those revenue volumes were obtained from the Office of Natural Resources Revenue, Statistical Information, http://statistics.onrr.gov/ReportTool.aspx
[i] The Hill, Raise Drilling Royalty Rates, June 19, 2015, http://thehill.com/policy/energy-environment/245539-top-dems-raise-drilling-royalty-rates
[ii] Greenwire, Liberal think tank urges BLM to hike royalty rates, June 19, 2015, http://www.eenews.net/greenwire/stories/1060020558/search?keyword=royalties+blm
[iii] BLM, Average Application for Permit to Drill (APD) Approval Timeframes: FY2005–FY2014, http://www.blm.gov/wo/st/en/prog/energy/oil_and_gas/statistics/apd_chart.html
[iv] North Dakota Petroleum Council, Submit your Comments, http://www.ndoil.org/?id=308
[v] Texas Railroad Commission, Oil & Gas, http://www.rrc.state.tx.us/oil-gas/
[vi] Bureau of Economic Analysis, http://bea.gov/newsreleases/regional/gdp_state/gsp_newsrelease.htm
[vii] http://www.petroleumnews.com/cgi-bin/start.cgi/bkoff-weekupdatetext.html
[viii] IHS CERA, Comparative Assessment of the Federal Oil and Gas Fiscal System, October 2011, http://www.boem.gov/Oil-and-Gas-Energy-Program/Energy-Economics/Fair-Market-Value/CERA-Final-Report.aspx
[ix] Marc Humphries, Congressional Research Service, U.S. Crude Oil and Natural Gas Production in Federal and Non-Federal Areas, Apr. 3, 2015, https://www.instituteforenergyresearch.org/wp-content/uploads/2015/04/CRS-federal-vs.-nonfederal.pdf
[x] Institute for Energy Research, Technically Recoverable Oil in the United States, May 1, 2012, https://www.instituteforenergyresearch.org/analysis/technically-recoverable-oil/ and Institute for Energy Research, North American Energy Inventory, http://www.energyforamerica.org/wp-content/uploads/2012/06/Energy-InventoryFINAL.pdf .
[xi] Energy Information Administration, Domestic First Purchase Price, http://www.eia.gov/dnav/pet/pet_pri_dfp1_k_m.htm and Henry Hub Spot Price, http://www.eia.gov/dnav/ng/ng_pri_fut_s1_m.htm
