
The Institute for Energy Research compared the impacts of hurricane activity and the Obama Administration’s oil policies on production in the offshore Gulf of Mexico to see which has the larger and more lasting impact. Although the shorter-term impacts of both are similar in size, Obama’s policies seem to have a more lasting effect. The Energy Information Administration (EIA) forecasts that offshore oil production in the Gulf of Mexico will not reach its peak 2010 production level at least through 2014, the farthest year out in the agency’s Short-Term Energy Outlook.
The graph below shows annual historical crude oil production in the Gulf of Mexico from 1994 through 2012, and projected crude oil production for the Gulf of Mexico in 2013 and 2014 based on EIA’s July 2013 Short-Term Energy Outlook. Oil production in the Gulf of Mexico took a downturn in 2005 due to hurricanes Katrina and Rita and then again in 2008 due to hurricanes Gustav and Ike. Another downturn occurred in 2011 because of the moratorium on drilling in the Gulf of Mexico that was instituted by the Obama Administration after the oil spill occurred there in April 2010 due to the Macondo accident, the Obama Administration’s subsequent moratorium on offshore drilling, and the Administration’s de facto moratorium (the “permitorium”) that continued once the original moratorium on offshore drilling was lifted. Oil production in the Gulf of Mexico has still not returned to pre-moratorium levels and the EIA is projecting that it will not return to pre-moratorium levels through 2014.
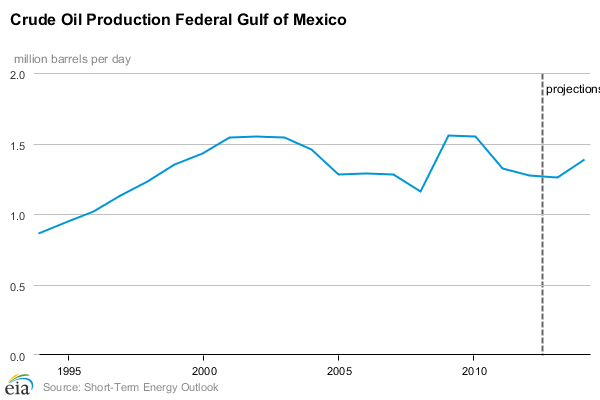
Source: Energy Information Administration, Short-Term Energy Outlook, June 2013, http://www.eia.gov/forecasts/steo/tables/?tableNumber=9#startcode=1994
Impact of Hurricanes on Oil Production in the Gulf
Hurricanes Katrina and Rita impacted oil production in the Gulf in August and September of 2005, respectively.[i] According to EIA, the Atlantic hurricane season of 2005 was the most active season since accurate recordkeeping began in 1944 with 15 hurricanes, seven of which were classified as Category 3 or higher. Five of the major hurricanes passed through the Gulf of Mexico, significantly disrupting oil and natural gas production there. In particular, hurricanes Katrina and Rita crossed through the heart of the Gulf’s oil and gas-producing region, resulting in major production declines.
Severe tropical weather is generally classified by the intensity of the weather system’s wind speeds. Tropical depressions are cyclones having a maximum sustained wind speed of 38 miles per hour (mph), tropical storms have a maximum sustained wind speed between 39 mph and 73 mph, and hurricanes have wind speeds greater than 73 mph. In the United States, hurricanes are categorized on the Saffir-Simpson scale by maximum wind speed: Category 1 (74-95 mph), Category 2 (96-110 mph), Category 3 (111-130 mph), Category 4 (131-155 mph), and Category 5 (156 mph or greater). Hurricane season officially runs from June 1 through November 30 when ocean waters are warm enough to spawn tropical cyclones. However, the majority (about 75 percent) of major hurricanes (Category 3 or greater) occur in August and September, as did hurricanes Katrina and Rita.
The Gulf of Mexico region is crucial to U.S. production of crude oil and natural gas. Nearly all of the Gulf’s Outer Continental Shelf production occurs in the offshore area north of the southern-most tip of Texas and west of the Florida panhandle. Oil and natural gas platforms are especially concentrated south of the Louisiana coastline.
When severe weather threatens, platform operators protect workers and facilities: non-essential personnel are evacuated to onshore locations, movable equipment is secured to avoid loss, and the well is secured by plugging the wellhead or closing wellhead valves so that oil and natural gas cannot escape in the event that the platform is destroyed or dislodged from its moorings. The production that is forgone during these precautions is referred to as shut-in production.
Hurricanes Katrina and Rita passed directly over the outer continental shelf producing region, as the figure below demonstrates.
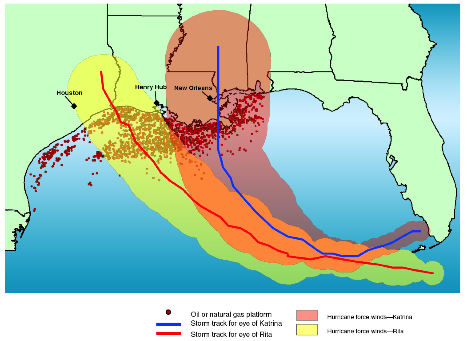
Source: Government Accountability Office, “Natural Gas: Factors Affecting Prices and Potential Impacts on Consumers” (GAO-06-420T), February 2006.
Prior to Katrina’s landfall, 79 percent of the Gulf platforms were evacuated and 1.4 million barrels per day of oil (95 percent of normal Gulf OCS daily production) was shut in. Hurricane Katrina destroyed 44 platforms. Prior to Hurricane Rita’s landfill, 93 percent of the Gulf platforms were evacuated, and 100 percent of normal daily oil production was shut in. Rita destroyed 69 platforms. In addition to the impacts on Gulf production, the hurricanes had significantly impacted midstream and downstream infrastructure. About 457 underwater pipelines were damaged. The Louisiana Offshore Oil Port temporarily stopped accepting shipments during both hurricanes. Some onshore crude oil refineries and natural gas processing facilities suffered heavy damage. Nearly 2 million barrels per day of refinery capacity were shut down either due to direct damage or interruption of power supplies when Hurricane Katrina hit Louisiana, and more than 4.9 million barrels per day of refinery capacity were shut down after Hurricane Rita hit the Texas coast.[i]
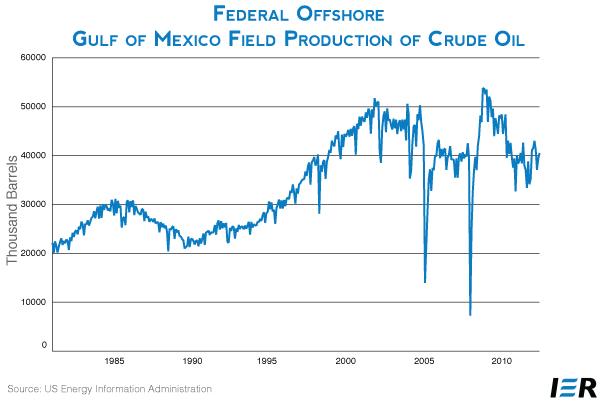
Hurricanes Katrina and Rita shut in about 70 percent of monthly production, as the figure below reveals.
In 2008, the Gulf of Mexico experienced two more hurricanes. Hurricane Gustav hit landfall as a Category 2 hurricane on September 1, 2008 near Cocodrie, Louisiana. On August 27, oil companies began evacuating personnel from their oil rigs in the Gulf amid continued forecasts that Gustav would strengthen and move into the gulf. By August 30, almost 77 percent of oil production in the Gulf of Mexico had been shut in. By mid-day August 31, 96 percent of oil production had stopped.[i]
Hurricane Ike, the costliest hurricane in Texas history, made landfall on September 13, 2008 near Galveston, Texas, as a category 2 hurricane. Hurricane Ike’s winds, surge and waves caused destruction to storage tanks and pipelines. Similar to Hurricanes Katrina and Rita, operators in the Gulf of Mexico shut in operations in advance of Ike’s approach as a precaution. As a result, oil production in the Gulf of Mexico dropped by about 1 million barrels per day in the immediate aftermath of the hurricane, i.e. Hurricane Ike shut-in about 80 percent of monthly offshore oil production in the Gulf. By late November, however, oil companies had restored oil production to pre-Ike levels.[ii]
Obama’s Moratorium and DeFacto Moratorium on Offshore Oil Production
Federal Gulf of Mexico oil production decreased in fiscal year 2011 and then again in fiscal year 2012 due to the Obama Administration’s policies: the moratorium on drilling that was implemented after the Macondo accident and the permitorium that followed. According to EIA, federal production peaked in fiscal year 2010 with a total of 723 million barrels produced.[iii] In that year, about 615 million barrels of oil were produced in federal offshore waters, mainly in the Gulf of Mexico where 579 million barrels of oil were produced. However, due primarily to the moratorium that the Obama administration placed on offshore drilling and to its subsequent permitorium, oil production in the federal waters of the Gulf fell by 77 million barrels in fiscal year 2011 (13 percent) and by another 47 million barrels in fiscal year 2012 (9 percent), with total production in that year at 455 million barrels. That is, oil production in the Gulf of Mexico was 124 million barrels less in fiscal year 2012 than in fiscal year 2010 when it hit its peak production.[iv]
Oil production in the Gulf of Mexico is on its way up in fiscal year 2013 with production averaging 2.6 million barrels more a month based on data for the first 7 months of fiscal year 2013. Yet, according EIA’s July Short-Term Energy Outlook, oil production in the Gulf will not return to fiscal year 2010 levels in either fiscal year 2013 or in fiscal year 2014. So, the Obama Administration policies instituted after the Macondo accident are having at least a 4-year impact on oil production in the Gulf of Mexico.
Below is a graph of oil production in the Gulf of Mexico and in the lower 48 states along with EIA’s forecast for oil production in 2013 and 2014. The shorter lines in the graph denote EIA’s forecasts for oil production prior to the hurricanes hitting the Gulf coast and prior to the Macondo accident. Before Hurricanes Katrina and Rita hit in 2005, EIA was forecasting that oil production in the lower 48 states would be 0.24 million barrels per day higher in 2005 than actually occurred. Because of the magnitude of destruction from those hurricanes, EIA’s forecast for oil production in the lower 48 was 0.43 million barrels per day higher in 2006 than occurred after the hurricanes hit. (EIA did not break out its Gulf of Mexico oil production forecast in 2005 and 2006.)
Hurricanes Gustav and Ike had less of a long-term effect on oil production in the Gulf than the earlier hurricanes. EIA’s forecast for oil production in the lower 48 states was 0.15 million barrels per day higher for 2008 than the level that actually occurred after these hurricanes landed and caused their destruction. As already mentioned, oil production was restored by November of 2008, so there was no additional impact in 2009.
EIA predicted prior to the Macondo accident that oil production in the Gulf in 2010 would be 0.25 million barrels per day higher than what actually occurred. The agency had also predicted before the accident that oil production in the Gulf in 2011 would be 0.44 million barrels per day more than what was actually produced in 2011. These numbers are very comparable to the impact that the destruction from Hurricanes Katrina and Rita caused in 2005 and 2006. In the case of these 2005 hurricanes, oil production resumed to their prior levels by 2009, even after having been struck with additional destruction from hurricanes Gustav and Ike in 2008. But, EIA expects that the high levels of oil production from the Gulf of Mexico will not return by 2014. The Obama policies will have a lasting impact on Gulf of Mexico oil production.[v]
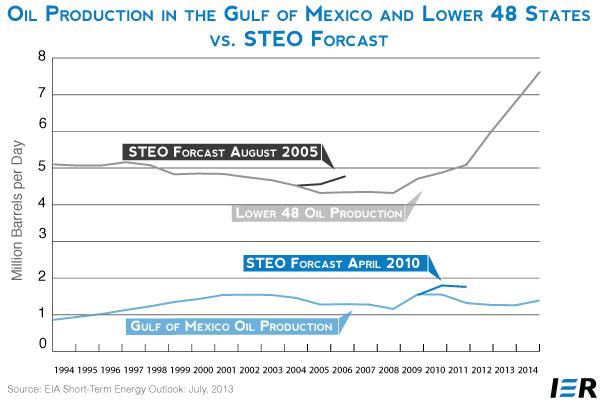
Source: Energy Information Administration, Short-Term Energy Outlook, July 2013, http://www.eia.gov/forecasts/steo/index.cfm, April 2010, http://www.eia.gov/forecasts/steo/archives/apr10.pdf, August 2005
If we assume that EIA’s forecast of 1.76 million barrels per day for offshore production in the Gulf of Mexico for 2011 would have continued through 2014 if it were not for Obama administration policies, the total lost oil production since 2010 would be about 750 million barrels, or almost the equivalent of one year’s federal oil production (offshore and onshore) at its peak. If we make a similar assumption regarding EIA’s pre Katrina oil production forecast to evaluate the lost oil production due to the hurricanes over time, lost production would have amounted to 560 million barrels for the 4 year period between 2005 and 2009. Thus, on a yearly basis, Obama’s programs instituted as a result of the Macondo accident are having a slightly greater impact on oil production than the combined effect of four devastating hurricanes.
Conclusion
Hurricanes Katrina, Rita, Gustav and Ike took a toll on U.S. oil production in the Gulf of Mexico, and it took years before oil production reached their prior levels. Yet, interestingly, the Obama Administration policies of placing a moratorium on offshore drilling after the Macondo oil spill accident seem to have a similar impact on short-term oil production levels in the Gulf. The longer-term effect of these administration policies on oil production in that region, however, may be even more lasting than the devastation caused by these very destructive hurricanes.
[i] Wikipedia, http://en.wikipedia.org/wiki/Hurricane_Katrina and http://en.wikipedia.org/wiki/Hurricane_Rita
[ii] Energy Information Administration, The Impact of Tropical Cyclones on Gulf of Mexico crude Oil and Natural Gas Production, http://www.eia.gov/forecasts/steo/special/pdf/2006_hurricanes.pdf
[iii] Wikipedia, http://en.wikipedia.org/wiki/Hurricane_gustav
[iv] Wikipedia, http://en.wikipedia.org/wiki/Hurricane_ike
[v] Energy Information Administration, Sales of Fossil Fuels Produced from Federal and Indian Lands, FY 2003 through FY 2012, May 2013, http://www.eia.gov/analysis/requests/federallands/pdf/eia-federallandsales.pdf
[vi] Energy Information Administration, http://www.eia.gov/dnav/pet/hist/LeafHandler.ashx?n=PET&s=MCRFP3FM1&f=M
[vii] Energy Information Administration, Short-Term Energy Outlook, July 2013, http://www.eia.gov/forecasts/steo/index.cfm, April 2010, http://www.eia.gov/forecasts/steo/archives/apr10.pdf, August 2005 http://www.eia.gov/forecasts/steo/archives/aug05.pdf
