
In typical EPA fashion, updated numbers on the agency’s Air Quality Trends report showing markedly improved air quality over the last two years, were released on the EPA website last month with no fanfare or public notice. Seeing as how the EPA has two primary concerns, water and air quality, it is strange to have no announcement, public notice or press release to demonstrate how well they are apparently doing in fulfilling their mission.
Sadly, this silent update is nothing new. Despite showing emissions of carbon monoxide (CO) down 40 percent, nitrogen oxides (NOx) down 42 percent and sulfur dioxide (SO2) dropping 60 percent, all since 2005; the agency stays silent, attempting to avoid any attention.[1] More curious, is that the 2010 figures from the website were not just updated, but removed. Ironically, the change from 2010 to 2012 in many emissions areas showed improvement in air quality increasing at a faster rate.[2]
FIGURE 1:
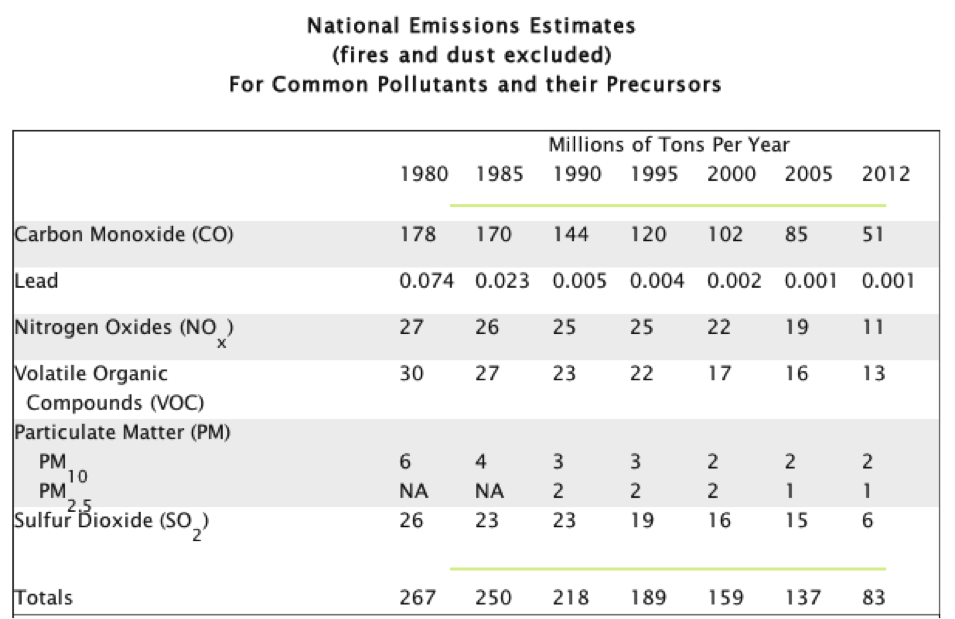
Source: http://www.epa.gov/airtrends/aqtrends.html#comparison
As IER explained when the numbers were last updated in 2010, Americans tend to have a distorted vision of the reality of air quality in this country. According to a 2004 study by the Foundation for Clean Air Progress, only 29 percent of people thought that “America’s air quality is better than . . . it was in 1970.”[3] Much of this confusion has to do with the fact that the media refuses to report fairly on improvements to environmental quality.
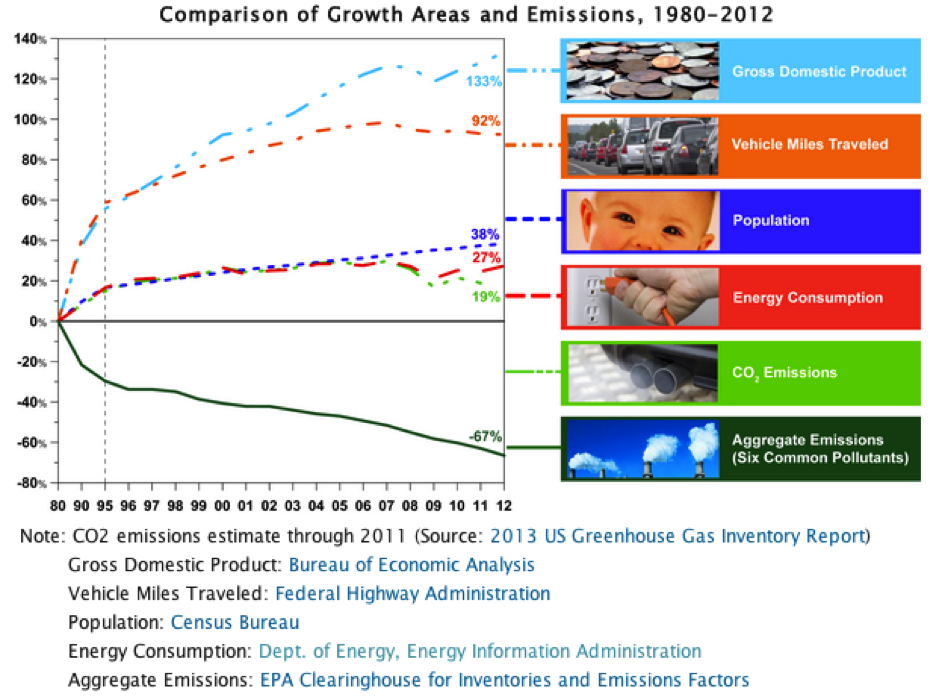
A look at the total improvement in emissions compared to economic and social changes in the country provides a clear view of just how dramatically the U.S. has improved air quality in the last 30 years. The below graphic, from EPA’s website, shows air quality trends since 1980. These trends are even more dramatic than the 2005 to 2012 numbers. It is especially striking that aggregate emissions have decreased 67 percent while vehicle miles traveled and population have grown 92 and 38 percent respectively.
FIGURE 2:
Misleading Negative Statistics
Even more troubling than the EPA refusing to acknowledge the great progress made in cleaning up the air we breathe, is the fact that these reports also contain a misleading statistic claiming that a large percentage of Americans are in danger, as they live in areas with poor air quality. This year that number is 142 million, or about 45 percent of the country. Predictably, if the media ever chooses to actually comment on the Air Quality Trends Report, this is the statistic that is emphasized.
There are three major problems with this statistic. First, it counts the total number of people living in a county with air quality concentrations above the level of NAAQS as those affected. Not the city, not the town, but the county. There is quite a difference in air quality possible from one end of a county to another, or from metropolitan city centers to its neighboring rural communities.
Second, there are six common pollutants measured to determine air quality. If a county is found to be above the acceptable level in any one single pollutant, the whole county is considered in danger, regardless of extenuating circumstances that could affect outlier pollutant readings and the level of the other five pollutants.
Finally, if the county is above the acceptable level some of the pollutants for more than just one day per year, the whole county is again deemed at risk. When these figures are viewed in context, it is clear the statistic of people living in areas of poor air quality is misleading. While casual readers would assume the country is living under a cloud of toxic emissions, the reality is quite different.
The map below shows that poor air quality readings are quite localized and cover very little percentage of the country. Again, a large population within these designated counties would actually not be affected, and if they are, it could be for as little as two days per year. As shown in green, a majority of the counties are in nonattainment for only one of the six pollutants.
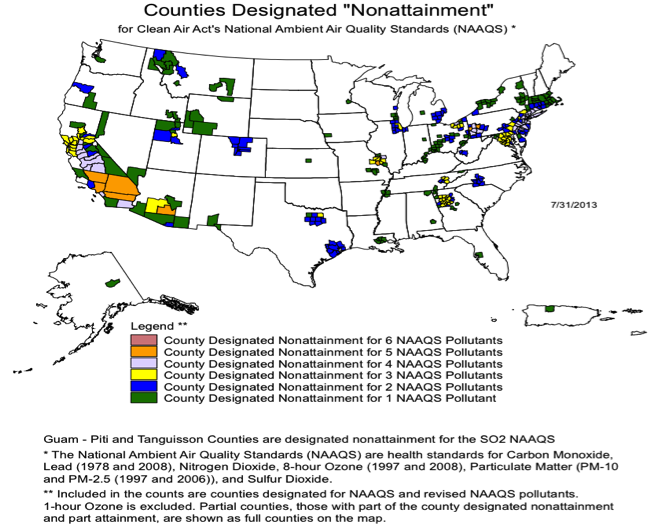
Source: http://www.epa.gov/oaqps001/greenbk/mapnpoll.html
Conclusion
The most recent release of the Air Quality Trends report by the EPA once again shows the political slant of the agency and their tendency to ignore transparency and public discourse in the hopes of furthering an ideological agenda. By neglecting to acknowledge the great success and progress made by the U.S. in lowering emissions and becoming more efficient, they further the deception that we are somehow retreating environmentally, to the smog-filled days of the industrial revolution. As a country we should be celebrating our successes in innovation, industry and the economy all while lessening our environmental impact. At the same time we should recognize that pushing for unnecessary and costly environmental mandates and restrictions limit our growth and prosperity. By perpetuating these misconceptions to the public the EPA not only fails to take credit for improvements, but also hinders honest public discussion of environmental policy and solutions based on fact and reason.
IER policy associate, Landon Stevens, authored this post.
[2] EPA, Air Quality Trends. (Archive) www.web.archive.org/web/20130607084645/http://epa.gov/airtrends/aqtrends.html
[3] Joel Schwartz, Blue Skies, High Anxiety. The American, May/June 2007, http://www.american.com/archive/2007/may-june-magazine-contents/blue-skies-high-anxiety/
