
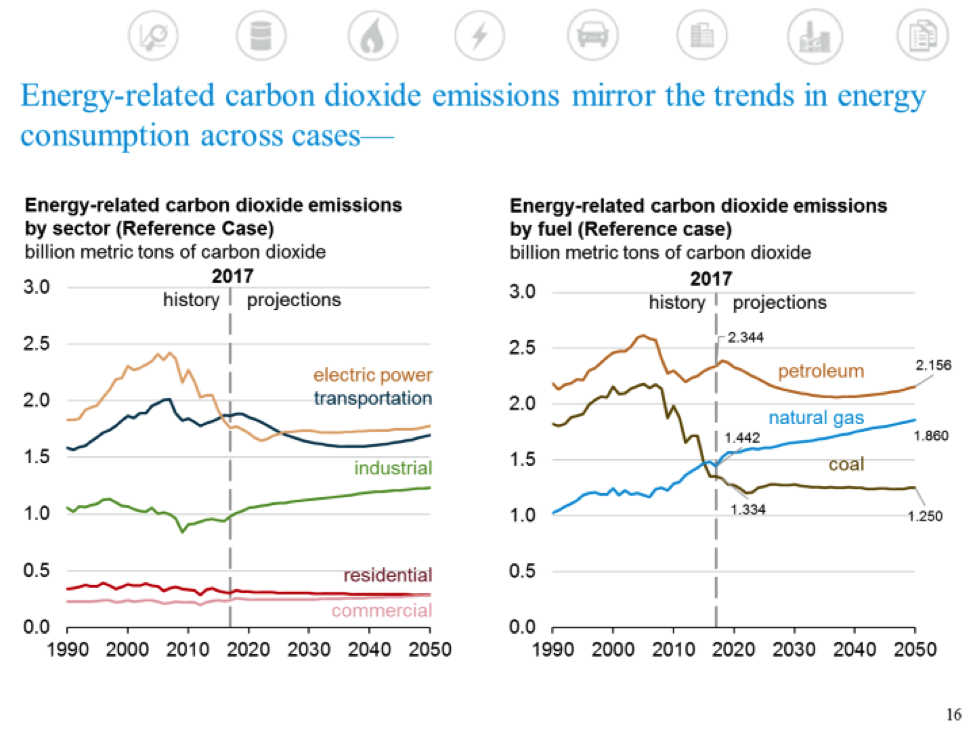
The Energy Information Administration’s (EIA) Annual Energy Outlook (AEO) 2018 projects that fossil fuels will supply 78 percent of the nation’s energy in 2050, only slightly down from 81 percent today. Further, carbon dioxide emissions in the agency’s forecast grow only slightly in the ensuing three decades—by just 1.8 percent between 2016 and 2050, despite the economy almost doubling over the 34-year forecast.
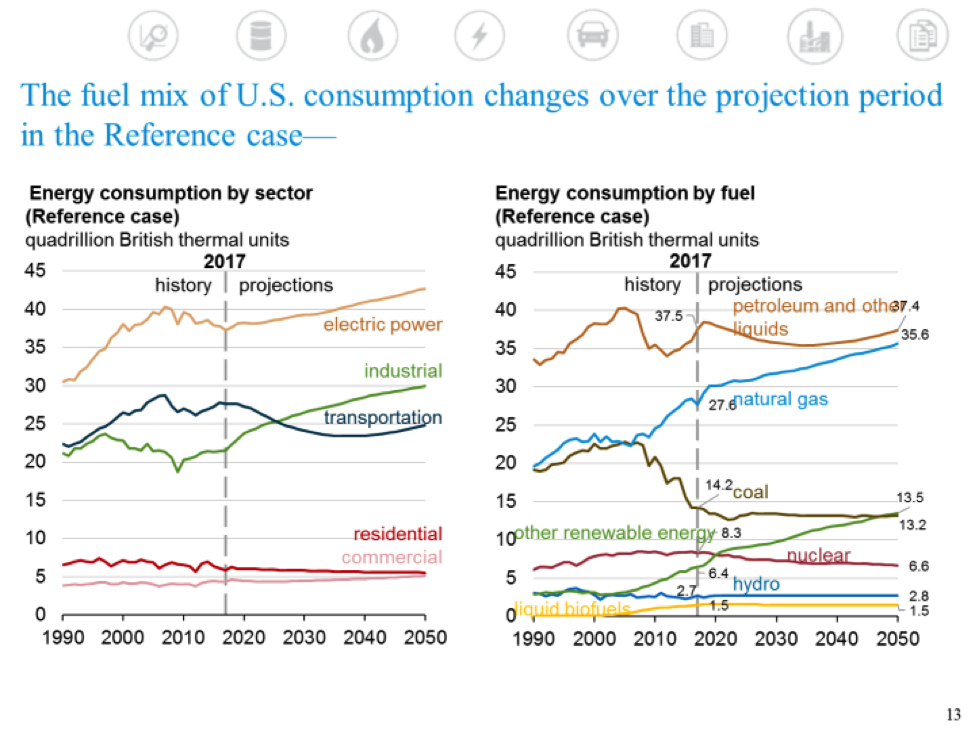
The mix of fuels is projected to change with natural gas and non-hydroelectric renewables garnering a larger share than today. Natural gas consumption grows the most on an absolute basis and non-hydroelectric renewable energy grows the most on a percentage basis. However, non-hydroelectric renewable energy makes only slight in-roads in this 34-year period, increasing from an 8 percent share in 2016 to a 13 percent share in 2050. Reflecting President Trump’s energy dominance policy, the United States becomes a net energy exporter by 2022.
Source: EIA
In EIA’s forecast, natural gas increases its share from to 29 percent in 2016 to 33 percent in 2050, while petroleum’s share declines from 37 percent in 2016 to 33 percent in 2050, and coal’s share declines from 15 percent in 2016 to 12 percent in 2050.
EIA projects that the economy will grow at 2.0 percent per year in its reference case; that energy consumption will grow at 0.4 percent per year; and that carbon dioxide emissions will grow at 0.1 percent per year between 2017 and 2050.
Source: EIA
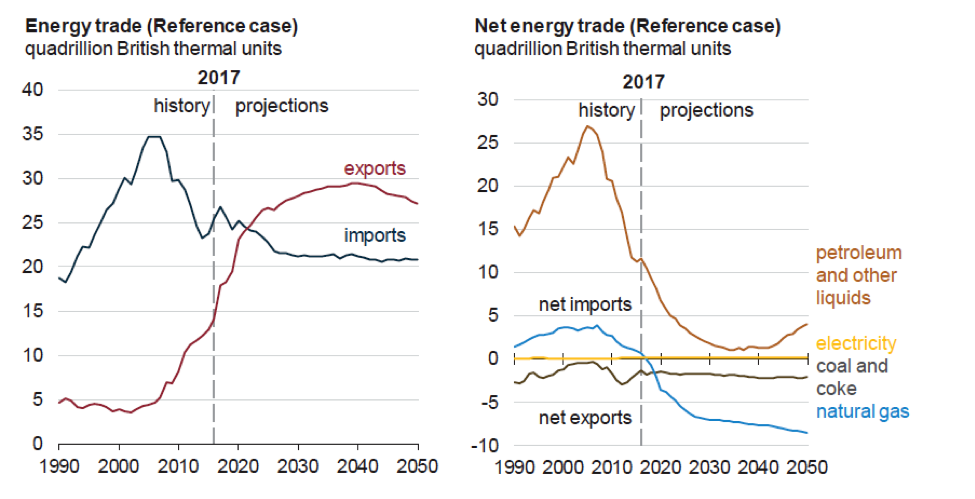
The United States has been a net energy importer since 1953, but that changes in the early 2020s as the United States decreases its imports and increases its exports. Most U.S. trade historically and in the projection period is in crude oil and petroleum products. The United States imports mostly crude oil and exports mostly petroleum products such as gasoline and diesel fuel. Except for the period between 2029 and 2045, the United States remains a net importer of petroleum and other liquids in EIA’s forecast.
In natural gas trade, the United States remains a net exporter with pipeline shipments to Mexico and Canada and liquefied natural gas (LNG) shipments to more distant destinations. The United States continues to be a net exporter of coal, but its export growth is not expected to increase significantly due to competition from suppliers closer to major international markets.
Source: EIA
Oil and Gas Sector
Natural gas production accounts for nearly 39 percent of U.S. energy production by 2050 in EIA’s reference case. Production from shale gas and tight oil plays as a share of total U.S. natural gas production is projected to continue to grow because of the large size of the associated resources, which extends over more than 500,000 square miles. To satisfy the growing demand for natural gas, production expands into more expensive-to-produce areas, putting upward pressure on production costs and prices.
Natural gas production is expected to grow 6 percent per year from 2017 to 2020–greater than the 4 percent per year average growth rate from 2005 to 2015. However, after 2020, it slows to less than 1 percent per year for the remainder of the projection. Natural gas growth in the near term is due to growing demand from large capital-intensive chemical projects and from the development of liquefaction export terminals in an environment of low natural gas prices.
Offshore natural gas production in the United States is expected to be almost flat over the projection period as production from new discoveries generally offsets declines in legacy fields. Production of coalbed methane gas is expected to decline through 2050 because of unfavorable economic conditions for producing that resource.

Source: EIA
U.S. crude oil production in 2018 is projected to surpass the 9.6 million barrels per day record set in 1970 and is expected to plateau between 11.5 million barrels per day and 11.9 million barrels per day as tight oil development moves into less productive areas and as well productivity declines. Lower 48 onshore tight oil development continues to be the main driver of total U.S. crude oil production, accounting for about 65 percent of cumulative domestic production in the reference case between 2017 and 2050. Continued technological advancements and improvements in industry practices are expected to lower costs and to increase the volume of oil and natural gas recovery per well.
Previously announced deep-water discoveries in the Gulf of Mexico lead to increases in offshore production in the contiguous U.S. through 2021. Offshore production then declines through 2035 and remains flat through 2050 as new discoveries offset declines in legacy fields.
The continued development of tight oil and shale gas resources supports growth in natural gas plant liquids production, which reaches 5.0 million barrels per day in 2023 in the reference case—almost a 35-percent increase from its 2017 level. Natural gas plant liquids production nearly doubles between 2017 and 2050, supported by an increase in global petrochemical industry demand.
Electricity Sector
This year’s AEO does not include the Clean Power Plan in its reference case as President Trump and EPA Administrator Pruitt plan to dismantle it. In the near term, fuel prices determine the share of natural gas-fired and coal-fired generation. But, in the longer term, the relatively low cost of coal moderates the decline in coal-fired generation. Growth in renewable generation in the near term is due mainly to federal tax credits, but is also influenced by state renewable portfolio standards.
The primary drivers for new capacity in the reference case are the retirements of older, less-efficient fossil fuel units, the near-term availability of renewable energy tax credits, and the assumed continued decline in the capital cost of renewables, especially solar photovoltaic. Low natural gas prices and favorable costs for renewable energy result in natural gas and renewables as the primary sources of new generation capacity.
Between 2011 and 2016, net coal capacity decreased by nearly 60 gigawatts, mostly as a result of compliance with the EPA’s Mercury and Air Toxics Standards. In EIA’s projection, coal-fired generating capacity decreases by an additional 65 gigawatts between 2017 and 2030 as a result of low cost natural gas and increasing renewable generation and then levels off near 190 gigawatts through 2050.
EIA projects substantial nuclear power retirements as the industry continues to have problems competing in competitive power markets. EIA expects nuclear electric generating capacity to decline from 99 gigawatts in 2017 to 79 gigawatts in 2050 (a 20-percent decline)—with no new plant additions beyond 2020.
Renewable generation is projected to increase 139 percent by 2050, led by wind and solar generation, which account for 94 percent of the total growth in the reference case. The extended federal tax credits account for much of the accelerated growth in these renewables in the near term. Solar photovoltaic growth continues throughout the projection period due to continued assumed decreases in solar PV costs.
Source: EIA
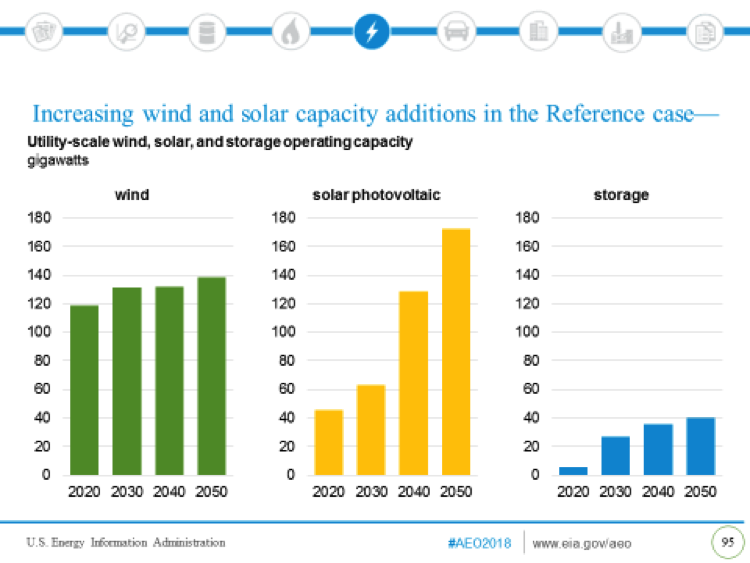
Between 2020 and 2050, utility-scale wind capacity is projected to grow by 20 gigawatts and utility-scale solar photovoltaic capacity is projected to grow by 127 gigawatts. Between 2018 and 2021, 80 gigawatts of new wind and solar photovoltaic capacity are added due to assumed declining capital costs and the availability of federal tax credits.
In AEO 2018, EIA represents two distinct solar photovoltaic technologies to account for the cost and value trade-offs between fixed-tilt and tracking-solar technologies. EIA also represented energy storage on the electric grid with four-hour batteries in AEO 2018 to model electric grid operations, including the integration of wind and solar generation.
Over the forecast period, utility-scale storage is expected to grow by 34 gigawatts. In the near term, policies such as storage mandates in California and market participation rules in the PJM electricity market support growth in storage systems to stabilize grid operations, improve utilization of existing generators, and integrate intermittent technologies such as wind and solar into the grid. In the longer term, wind and solar growth are projected to support economic opportunities for storage systems and enable renewable generation produced during the hours with high wind or solar output to supply electricity at times of peak electricity demand.
Conclusion
EIA sees fossil fuels as dominating the U.S. energy sector through 2050, despite significant penetration of wind and solar power for electric generation. EIA’s forecast retires 85 gigawatts of coal and nuclear capacity and replaces them with natural gas, wind, and solar capacity spurred by low natural gas prices, federal tax credits for wind and solar, and state renewable portfolio standards, with solar PV increasing the most.
