
The Energy Information Administration (EIA) recently announced that U.S. oil production in 2014 had the largest one-year volume increase in over 100 years. U.S. crude oil production increased by 1.2 million barrels per day to 8.7 million barrels per day in 2014–the largest increase since recordkeeping began in 1900. Oil production increased by 16.2 percent in 2014–the highest annual growth rate since 1940. The shale formations in North Dakota, Texas, and New Mexico were the major contributors to the increase due to hydraulic fracturing and directional drilling technology. Crude oil production increased in each of the last six years—a reversal of the trend from 1985 to 2008 in which crude oil production fell in all but one year. (See chart below.)[i]
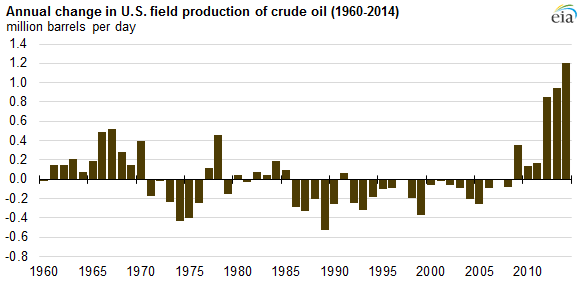
Source: Energy Information Administration, http://www.eia.gov/todayinenergy/detail.cfm?id=20572
Oil Production Is Still Expected to Increase
EIA expects U.S. oil production to increase in 2015 and 2016, to 9.3 million barrels per day in 2015 and 9.5 million barrels per day in 2016–close to the 9.6 million barrels per day highest annual average level of U.S. production in 1970. According to EIA’s Short-Term Energy Outlook, crude oil production is expected to grow by 8.1 percent in 2015 and 1.5 percent in 2016.[ii] The fact that the expected growth is less than what occurred in 2014 is due to the drop in oil prices that began in June 2014. Since mid-2014, the price of crude oil has dropped about 50 percent, due to both a glut in oil supply and a weak demand. The price drop has slowed production in marginal drilling wells and focused investment in the more lucrative shale oil formations. The magnitude of the change in drilling can be seen in the decline in the number of active oil rigs that are now less than half the number they were before the price decline.
U.S. Oil Production Edging Near Russia and Saudi Arabia
According to EIA’s International Energy Statistics, Russia produced 10.76 million barrels per day of oil in 2013 and just slightly more during the first 3 quarters of 2014.[iii] (See Chart below.) Saudi Arabia produced 11.7 million barrels of oil per day in 2013 and are producing an average of 11.6 million barrels per day through the first 3 quarters of 2014.[iv] These numbers include oil production with condensates, natural gas and other liquids production, and refinery processing gain. If total oil supply based on these numbers are compared, the United States actually produces more oil than these other countries because the United States produces far more oil from natural gas and other liquids (e.g. ethanol) and refinery gain than do the other countries. However, on a pure oil and condensate production basis, the United States is producing 1 to 1.5 million barrels per day less than these other countries.
If EIA’s predictions are correct for this year and next, the United States will be close to producing the oil and condensate levels of Russia and Saudi Arabia that rank as the world’s top oil producers. If one was to measure production based on oil with condensates and natural gas liquids, production in the United States in 2014 would be about the same as Saudi Arabia’s production and more than Russia’s.
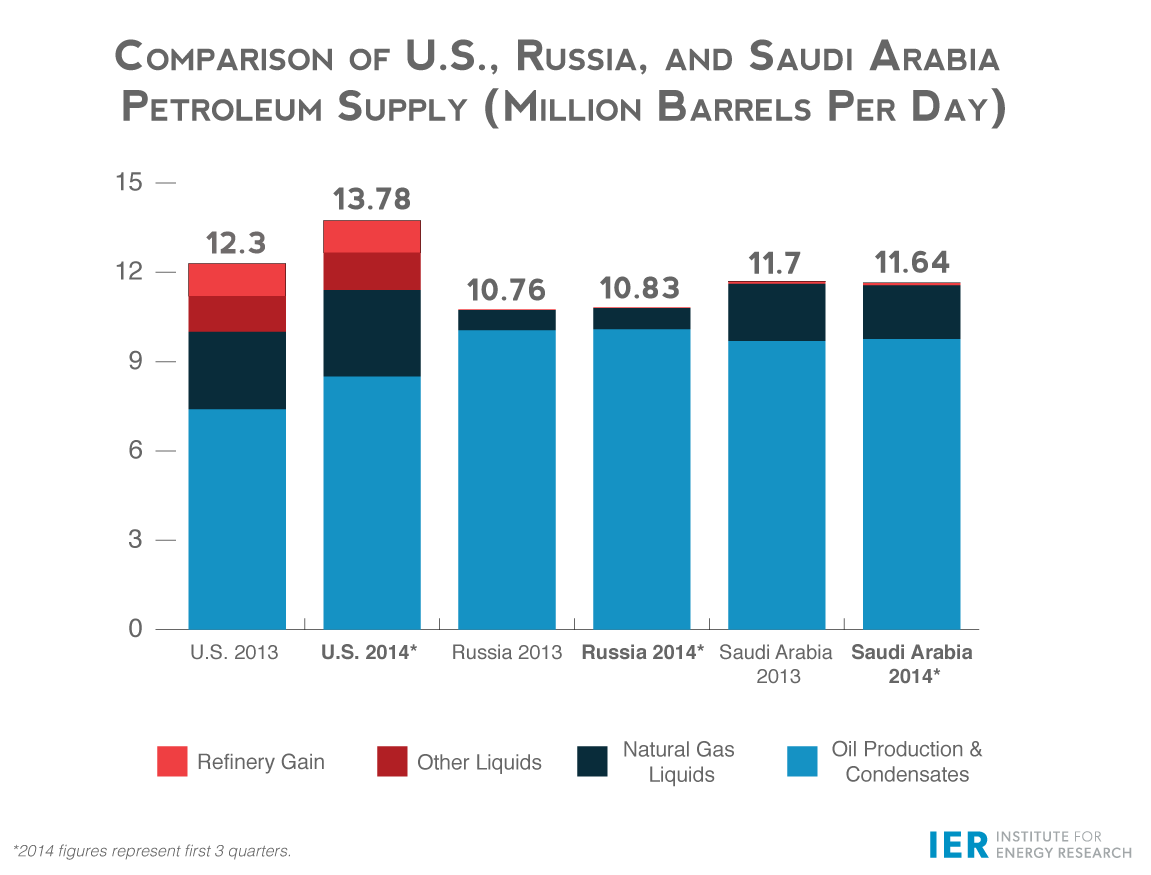
Source: Energy Information Administration, International Energy Statistics, Petroleum Production Annual Data and Quarterly Data, http://www.eia.gov/cfapps/ipdbproject/IEDIndex3.cfm?tid=5&pid=53&aid=1 and http://www.eia.gov/cfapps/ipdbproject/iedindex3.cfm?tid=50&pid=53&aid=1&cid=&syid=2014&eyid=2014&freq=Q&unit=TBPD
Conclusion
Due to a shale oil boom created by the ingenuity of the nation’s oil and gas industry, the United States is vying for the number one ranking in oil and condensate production with Russia and Saudi Arabia. The increase in U.S. oil production in 2014 was the largest in over 100 years, and according to EIA, production will only continue to increase.
[i] Energy Information Administration, U.S. oil production growth in 2014 was largest in more than 100 years, March 30, 2015, http://www.eia.gov/todayinenergy/detail.cfm?id=20572
[ii] Energy Information Administration, Short-Term Energy Outlook, March 10, 2015, http://www.eia.gov/forecasts/steo/
[iii] Energy Information Administration, International Energy Statistics, Petroleum Production Annual Data, http://www.eia.gov/cfapps/ipdbproject/IEDIndex3.cfm?tid=5&pid=53&aid=1 and Short-Term Energy Outlook, March 10, 2015, http://www.eia.gov/forecasts/steo/
[iv] Energy Information Administration, International Energy Statistics, Petroleum Production Annual Data and Quarterly Data, http://www.eia.gov/cfapps/ipdbproject/IEDIndex3.cfm?tid=5&pid=53&aid=1 and http://www.eia.gov/cfapps/ipdbproject/iedindex3.cfm?tid=50&pid=53&aid=1&cid=&syid=2014&eyid=2014&freq=Q&unit=TBPD
